
Hi...
Let's see.
This is with internal generator.
(Internal generator was btw. also used for creating the calibration file)
I still cannot figure out about the [FS sine Vrms]
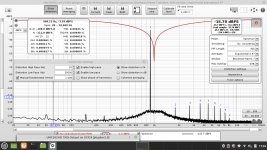
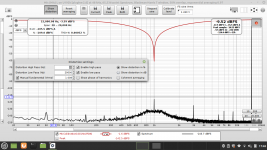
EDIT :: Picture uploaded with sweep, with notch & Mic. Calibration.
It's looking like, when looking at the last picture (Sweep_with_notch_and_Mic-Calibration), that if putting the sweep (green) upside-down, it's fit where the 1000Hz spike appears.
Jesper.
Let's see.
This is with internal generator.
(Internal generator was btw. also used for creating the calibration file)
I still cannot figure out about the [FS sine Vrms]
EDIT :: Picture uploaded with sweep, with notch & Mic. Calibration.
It's looking like, when looking at the last picture (Sweep_with_notch_and_Mic-Calibration), that if putting the sweep (green) upside-down, it's fit where the 1000Hz spike appears.
Jesper.
Attachments
Last edited:
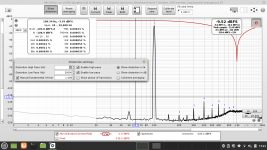
That's nice to see that the cal file nicely normalises on either side of the notch up to quite close to the notch, and certainly within the 2HD at 2kHz. I'll try that sometime with my passive notch as so far I have just lived with the un-normalised response of my passive notch on either side of the fundamental.
One aspect of the notch is that it may not perfectly align with Victor's frequency, and REW's frequency will depend on whether you have 'Lock frequency to RTA FFT' enabled or not, and if not then the FFT Length setting.
I don't typically use the calibrate level option of REW and just use an external meter to confirm what the RTA level aligns to, and from that determine the harmonic levels wrt -dB from the fundamental.
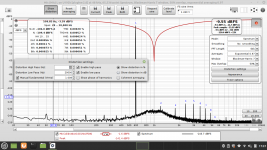
Can someone check this THD numbers if they are resonable? I am messauring through my Symasym amp 1w output.
As a generator I use the FY6900,I guess the Fy6900 dont have superlow distortion..?

As a generator I use the FY6900,I guess the Fy6900 dont have superlow distortion..?
You will not be able to measure real distortion with your 1kHz signal ~-50dB below soundcard sensitivity.
You need to have signal close to 0dB. Either by adjusting signal into amp, or better by setting soundcard sensitivity higher.
You need to have signal close to 0dB. Either by adjusting signal into amp, or better by setting soundcard sensitivity higher.
The soundcard is allready turned up max,If I turn up the voltage on the generator I getting nearer the max power on the Symasym ,I am at about -25db.
There have to be a cache somewere.
There have to be a cache somewere.
Ryssen, what are we meant to check? You have only provided a single plot, with no other information that is sufficient to assess. 1W doesn't mean anything for a plot that shows voltage response. There is no loopback response to show your base performance or calibration. There are no absolute voltage measurements.
Hi all.
For feedback here, and for everyone interested to know, i had my quistions answered here at another forum.
I also verified that the way i use my notch is correct there.
Check it out : https://www.avnirvana.com/threads/n...nnot-undertand-the-use-of-fs-sine-vrms.10446/
Jesper.
For feedback here, and for everyone interested to know, i had my quistions answered here at another forum.
I also verified that the way i use my notch is correct there.
Check it out : https://www.avnirvana.com/threads/n...nnot-undertand-the-use-of-fs-sine-vrms.10446/
Jesper.
You have to guide me..How do I set the calibrate level.Is there anything else I can set?Ryssen, what are we meant to check? You have only provided a single plot, with no other information that is sufficient to assess. 1W doesn't mean anything for a plot that shows voltage response. There is no loopback response to show your base performance or calibration. There are no absolute voltage measurements.
Is this better? I really cant push the amp much more,I have 20,5v output now.
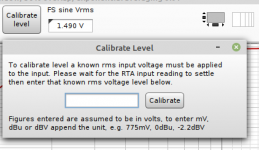
I did the calibration I Wrote 1,4v wich is what I feeding in to the amp.

I did the calibration I Wrote 1,4v wich is what I feeding in to the amp.
Are you saying that 20.5Vrms is sent directly to your soundcard input (the input channel IN-01 that is being displayed on your RTA plot)?
Can you make a loopback RTA measurement, that connects your signal generator to your soundcard input, but without the amplifier included, and measure the signal voltage being sent directly to your soundcard input ?
Can you make a loopback RTA measurement, that connects your signal generator to your soundcard input, but without the amplifier included, and measure the signal voltage being sent directly to your soundcard input ?
I am using a Pc Interface https://sound-au.com/project154.htm
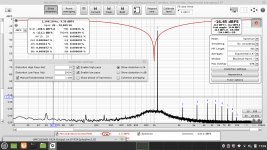
This is with the generator straight in to the interface the 1 v setting the generator is set for 3v out:

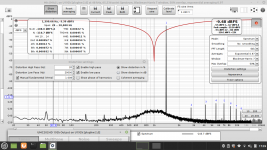
This is with the Symasym in the signalpath,1.20v out of the amp.

When messauring distortion in an amp,how high much should the amp be driven?
By the way I have bypassed the opamp in the interface..
This is with the generator straight in to the interface the 1 v setting the generator is set for 3v out:
This is with the Symasym in the signalpath,1.20v out of the amp.
When messauring distortion in an amp,how high much should the amp be driven?
By the way I have bypassed the opamp in the interface..
Ryssen, the REW RTA window allows the Y axis to be modified so that the plot doesn't show the region from -240 to say -120dBFs. The top of the plot also doesn't need to have 40dB of clear air. Similarly the X-axis can be restricted to say 10Hz to 24kHz. That will make each plot much easier to interpret.
Your two plots indicate that the noise floor increases by about 10dB when adding the Symasym. Did you also change the probe interface from 1V to 10V settings between those two plots (given the 1.2V level for the second plot) ?
You should also spend some time getting to appreciate how averaging works in REW, as a way to lower the observed noise floor. There are many REW options that influence noise floor, although in your situation you should also read up on and get some experience with the 'coherent averaging' option as you are using REW to generate your signal. Also you should have the option selected for the signal generator to be locked to the RTA FFT.
Perhaps then redo your two plots again and repost 🙂
Here is through the amp,745mv,No I dont switsch to 10v from the 1 v ,as the sound card can take 2 v RMS on the input.
I have 16 Avereages.What am I supposted to write in the Calibrate level?

I have 16 Avereages.What am I supposted to write in the Calibrate level?
That plot formatting and averaging makes it easier to interpret the noise and harmonic levels. The strange aspect now is that your plot shows no 50Hz or 150Hz peaks, and the 200 +n100 peaks are higher, when compared to earlier plots. Can you elaborate on what has changed?
With respect to signal harmonics, the HD levels are reasonably low.
You may be able to revert to using the soundcard signal generator (ie. not Victor's) as that can allow other advanced REW functions to be used for investigations. Eg. if HD levels are sufficiently above the noise floor for a loopback with the DUT, then you could do a 'stepped sine' measurement for 'step level' to identify how HD % changes and when clipping occurs in your DUT.
There is no requirement to enter anything in the 'Calibrate level' preset - I don't - if you want to try options like that then best to read through the Help notes on that item, and even google search for examples of its use in posts.
It seems the spikes at 50 and 150 only is on one channel,if I turn the DUT off I still get those spikes so it most be the computer its comming from.

I even managed to do a stepped sinus test:

But how do I read it?
I even managed to do a stepped sinus test:
But how do I read it?
What did you change to lower the noise floor by ~15dB between post #1335 and #1337 - was it just the removal of the DUT from the loopback?
The 'stepped sine' measurement I was referring to uses the 'step level' to identify how HD % changes with level (at just one test frequency such as 1kHz), and when clipping occurs in your DUT.
It is worthwhile to summarise the test conditions when posting a plot - otherwise there is doubt as to what the plot refers to.
The RTA just shows H2, H3 and THD as a progress indication for stepped sine, the result is saved as a measurement so you can get the full results on the Distortion graph in the main REW window.I even managed to do a stepped sinus test:
But how do I read it?
- Home
- Design & Build
- Software Tools
- How to - Distortion Measurements with REW