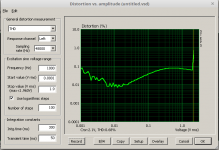
Very true. By its statistic nature you cannot compensate noise by "anti-noise". And keep in mind that harmonics vary with sound card level, so you have to re-align the compensation each time you change the level.Looking at your numbers THD+N in your case is mostly noise (see N). Lowering harmonics does not lower noise.

Ah go it. Makes sense. Thanks for the explanation to both of you.Looking at your numbers THD+N in your case is mostly noise (see N). Lowering harmonics does not lower noise.
You can adjust the high-pass and low pass frequency settings in the Distortion panel to diagnose what frequency bands contribute most to the N value. As an aside, I think even Victor's oscillator contributes more noise under certain circumstances (related to its control of output signal level).
You can include coherent averaging to better discern harmonic levels as you try to null them, but note that the lowered noise floor is an artefact of the averaging process and not an indicator of an actual lowered noise floor. However it can allow you to play around with inserting loopback attenuation and notch filtering to try and ascertain if the DAC or ADC sides are dominating the distortion generation, and hence get a better feel for how low the distortion may actually be when using the DAC side as an oscillator output.
You can include coherent averaging to better discern harmonic levels as you try to null them, but note that the lowered noise floor is an artefact of the averaging process and not an indicator of an actual lowered noise floor. However it can allow you to play around with inserting loopback attenuation and notch filtering to try and ascertain if the DAC or ADC sides are dominating the distortion generation, and hence get a better feel for how low the distortion may actually be when using the DAC side as an oscillator output.
Tascam US-122L Also cheap on ebay. This and the M-Audio are the two audio i/0 devices I have on hand

The harmonics are in the noise floor region - you may get more certainty by selecting coherent average, or alternatively by using a longer FFT length with 32 averages. A step level plot may also be enlightening.Loopback for M-Audio JamLab, cheap on ebay - 250mV out to in.
It's hard measuring a differential output with a single ended input...
My solution is a small 600 Ohm signal transformer. That transformer has a distortion versus frequency profile too; 2nd, 3rd, 5th, etc
Given the way dbV adds, when do I have to be worried that the harmonics I'm seeing are the instrumentation chain, versus the Device?
In other words, the distortion profile of the instrumentation chain will mask any distortion of the amp - as long as the amp is actually xxdbV lower.
If the distortion frequency profile of the amp is at least xxdbV higher than that of the instrumentation chain, then the instrumentation isnt contributing anything, really - it''s all the DUT.
So as long as I know my "loopback profile", I could probably test a mundane tube amplifier and be pretty sure what I'm seeing is ALL amplifier (given that every frequency displayed is at least xxdbV above what the loopback profile shows) What's the xxdbV threshold?
Something like if the amplifier is actually making a 45 dbV tall 2nd and I know the instrumentation chain has a 35 dbV tall 2nd, (above the noise floor) when added together the instrumentation is only contributing the fractional part of a 45.4 dbV measurement. 10? 12? 20?
Once I was tempted to use xformers at this very application, too, as this would be quite a simple solution. But THD performance of audio xformers is poor due to hysteretic effect. The plot shows 1kHz-THD of a pretty good audio transformer made by German brand Pikatron. Measuring an off-the shelf passive DI-box even yields one magnitude of order more THD.It's hard measuring a differential output with a single ended input...
My solution is a small 600 Ohm signal transformer. That transformer has a distortion versus frequency profile too; 2nd, 3rd, 5th, etc
Given the way dbV adds, when do I have to be worried that the harmonics I'm seeing are the instrumentation chain, versus the Device?
In other words, the distortion profile of the instrumentation chain will mask any distortion of the amp - as long as the amp is actually xxdbV lower.
If the distortion frequency profile of the amp is at least xxdbV higher than that of the instrumentation chain, then the instrumentation isnt contributing anything, really - it''s all the DUT.
So as long as I know my "loopback profile", I could probably test a mundane tube amplifier and be pretty sure what I'm seeing is ALL amplifier (given that every frequency displayed is at least xxdbV above what the loopback profile shows) What's the xxdbV threshold?
Something like if the amplifier is actually making a 45 dbV tall 2nd and I know the instrumentation chain has a 35 dbV tall 2nd, (above the noise floor) when added together the instrumentation is only contributing the fractional part of a 45.4 dbV measurement. 10? 12? 20?
The best solution is a soundcard with symmetric input.
As a rule of thump, THD performance of measuring setup should be 10dB better than the unit under test.
Attachments
Agreed,
Substracting harmonic distorsion is a risky business, that is just not how it works.
Your Tascam has balanced TRS inputs.
I would not mess around with transformers for this application, unless you know exactly what you're doing.
If the input/output levels were set correctly, the issue with the audio interfaces above is that it's either noise or distorsion.
At around -70db thd+n loopback, you can expect measuring thd+n in the 0.1 - 1% range.
As a general rule I assume that the real THD is better than the numbers my imperfect measuring setup delivers.Agreed,
Substracting harmonic distorsion is a risky business, that is just not how it works.
Your Tascam has balanced TRS inputs.
I would not mess around with transformers for this application, unless you know exactly what you're doing.
If the input/output levels were set correctly, the issue with the audio interfaces above is that it's either noise or distorsion.
At around -70db thd+n loopback, you can expect measuring thd+n in the 0.1 - 1% range.
Then, how does it work? Do you need to know the relative phase angle as well, to do a successful subtraction?Substracting harmonic distorsion is a risky business, that is just not how it works.
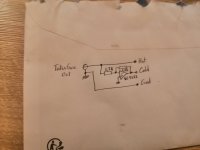
Ok - I'll try to work up a resistor + cap pad to make use of the Tascam's diff inputs. I'm trying to look at a class D amp with BTL output; both +, - outputs sit ~10V above signal input ground.
Aaaand, now I'm presented with the opposite problem. I dont think REW will generate two out of phase outputs for the loopback test. Which of course I'd want - to see what the differential input measurement system response is. 'Course, even if I had that situation available, harmonics may then cancel that would still be present in the single ended drive I'd be using at the amp input. Sigh.
Knowing that your result at any given frequency spike is 10-12 db higher than corresponding points on the loopback data, is so much easier. Doing amplifier floating output distortion measurements with confidence isnt easy!
In the sorting this out process some might jokingly call "an attempt was made", I managed to drive one BTL channel through a 1uF cap into ground - along the length of a 3.5 mm stereo cord. Which happens to have molded EMI ferrites on each end. At the end plugged into the M-Audio, the molded on ferrite was hot to the touch. I neither blew up the amplifier, nor the M-Audio unit, making that mistake.
That's when I thought of the transformer as isolation.
There is a nice chapter inside the Arta manual that 'explains' the estimation procedure and the averaging in fft analysis. This is a simplified version of what's going on but it kind of gives an idea of the process.Then, how does it work? Do you need to know the relative phase angle as well, to do a successful subtraction?
Ok - I'll try to work up a resistor + cap pad to make use of the Tascam's diff inputs. I'm trying to look at a class D amp with BTL output; both +, - outputs sit ~10V above signal input ground.
Aaaand, now I'm presented with the opposite problem. I dont think REW will generate two out of phase outputs for the loopback test. Which of course I'd want - to see what the differential input measurement system response is. 'Course, even if I had that situation available, harmonics may then cancel that would still be present in the single ended drive I'd be using at the amp input. Sigh.
Knowing that your result at any given frequency spike is 10-12 db higher than corresponding points on the loopback data, is so much easier. Doing amplifier floating output distortion measurements with confidence isnt easy!
In the sorting this out process some might jokingly call "an attempt was made", I managed to drive one BTL channel through a 1uF cap into ground - along the length of a 3.5 mm stereo cord. Which happens to have molded EMI ferrites on each end. At the end plugged into the M-Audio, the molded on ferrite was hot to the touch. I neither blew up the amplifier, nor the M-Audio unit, making that mistake.
That's when I thought of the transformer as isolation.
https://artalabs.hr/download/ARTA-user-manual.pdf
For two out of phase outputs you can simply invert the signal with a G=-1 opamp. That is basically the schematic of a cheap balanced output. it costs less than a dollar and will work just fine in most cases. It will cancel (considerably reduce) external nonlinearities only. You're also working with 6dB extra headroom (2 times the signal, assuming you're driving a balanced input), which is nice.
I do not have that much experience with class D amps but if you use a dc bypass make sure you double check your capacitor value vs load. Even if the cutoff is well below the audio band it can generate extra distorsion at low freq.
I guess the next step for better precision is to check your soundcard ad/da converters specs and see if there's room for diy improvements.
Attachments
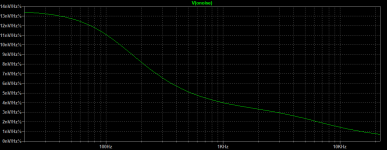
As a part of a project I'm working on I needed accurate data on the noise floor of my notch filter in the freq. range from 20Hz to 22kHz.
LtSpice produced the noise curve in the first attachment, resulting in an integrated noise of 331nVrms within the BW mentioned.
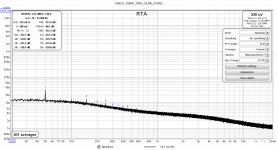
Then I measured the setup (a Hall-topology notch filter with a 50 Ohm resistor at the input, followed by a 60dB LNA, both designed by S. Groner) using a modified Motu AudioExpress interface, and obtained the results shown in the 2nd attachment. The simulated and measured noise curves are visually almost the same (note that the measured values are 1000x higher because of the LNA, whose noise of 0.4 nV/rtHz RTI is negligible in this case). Both curves are in terms of V/rtHz, and should thus produce similar integrated noise values, i.e. around 330uVrms.
However, in the distortion panel RTA returns a value of 208uVrms, which confuses me quite a bit.
In the measurement file there are two noise figures ("-69.4 dBV 22 - 22k UNW", which evaluates to 339uVrms, and "N: -90.7 dB [20..22000 Hz]" which with the manually entered FS value of 7.1V yields the integrated noise value of 208uVrms previously mentioned.
I double-checked the measurements and found no apparent mistakes in the hardware.
The difference between the two values is 4dB; if it had been about 6dB, an explanation could be sought in the application of the ENBW correction (6.2dB for the spectral window and the spectral resolution used).
So I wonder if I overlooked something.
Regards,
Braca
LtSpice produced the noise curve in the first attachment, resulting in an integrated noise of 331nVrms within the BW mentioned.
Then I measured the setup (a Hall-topology notch filter with a 50 Ohm resistor at the input, followed by a 60dB LNA, both designed by S. Groner) using a modified Motu AudioExpress interface, and obtained the results shown in the 2nd attachment. The simulated and measured noise curves are visually almost the same (note that the measured values are 1000x higher because of the LNA, whose noise of 0.4 nV/rtHz RTI is negligible in this case). Both curves are in terms of V/rtHz, and should thus produce similar integrated noise values, i.e. around 330uVrms.
However, in the distortion panel RTA returns a value of 208uVrms, which confuses me quite a bit.
In the measurement file there are two noise figures ("-69.4 dBV 22 - 22k UNW", which evaluates to 339uVrms, and "N: -90.7 dB [20..22000 Hz]" which with the manually entered FS value of 7.1V yields the integrated noise value of 208uVrms previously mentioned.
I double-checked the measurements and found no apparent mistakes in the hardware.
The difference between the two values is 4dB; if it had been about 6dB, an explanation could be sought in the application of the ENBW correction (6.2dB for the spectral window and the spectral resolution used).
So I wonder if I overlooked something.
Regards,
Braca
Attachments
Maybe “UNW” means unweighted whereas the 208uV value is not? Even the range of 208uV to 339uV range is pretty good agreement to LTSpice model prediction. It all depends on how good your models are.
1000X less would be 339nV/sqrtHz. It's 1000x greater because of the 60dB LNA. 331 with LTSpice to 339 actual measurement is dead on in my book. BTW, you can make the scale read directly with the 60dB LNA in circuit by changing the calibration amount 1000X smaller. On mine I go from 9.441V to 9.441mV.
The figures in the distortion panel are not meaningful in the absence of a fundamental, the N figure is THD+N minus THD. A bit of 50 Hz hum pickup is being treated as a fundamental since it is the highest thing in the measurement. The UNW figure is the total in-band (22 Hz to 22.4 kHz) unweighted rms level. The main rms level figure shown at the top of the levels panel is for the band between the distortion high pass and low pass frequencies, when they have been set,As a part of a project I'm working on I needed accurate data on the noise floor of my notch filter in the freq. range from 20Hz to 22kHz.
Thank you, JohmPM.The figures in the distortion panel are not meaningful in the absence of a fundamental, the N figure is THD+N minus THD. A bit of 50 Hz hum pickup is being treated as a fundamental since it is the highest thing in the measurement. The UNW figure is the total in-band (22 Hz to 22.4 kHz) unweighted rms level. The main rms level figure shown at the top of the levels panel is for the band between the distortion high pass and low pass frequencies, when they have been set,
It's been clear to me that the UNW figure was the correct result in my case, but the missing information was just what the N figure in the distortion panel stands for, i.e. how it is calculated.
Hello here.
While i'am being modding my Behringer UMC202HD for a while, getting good results, i thought i would post it here.
Long story short; I have the following mod's: (See this thread if any interest https://www.diyaudio.com/community/threads/behringer-umc-202hd-for-measurements.341309/ )
My Setup :

Well this thread is not a mod thread, just wanna tell the story short.
A sine to the balanced input typically looks like this :
This is with Victor's 1KHZ osc.

I use REW and i understand a lot of things which can be done with this excellent program.
Recently i had a conversation with Victor, and he gave me a schematic for a notch filter (1KHz)
I did a quick mockup, but having no box/enclosure yet, i get a lot of noise ofcause, but i did ran a measurement of it:

I have used a lot of time, understanding the use of this (Reading reading reading etc... 🙂 ), and so far i know that, the notch will filter everything out, except the 1KHz we are interested in sending to the DUT.
But when trying to send the 1KHz into the Behringer there are a lot of attenuation also.
I cannot figure out how i should use it.
Also it will be some time until i get it packet up in a closed box, but i still wan't to learn in meantime.
Hope someone would explain to me, howto ?
Thank's all
Rgds; Jesper.
While i'am being modding my Behringer UMC202HD for a while, getting good results, i thought i would post it here.
Long story short; I have the following mod's: (See this thread if any interest https://www.diyaudio.com/community/threads/behringer-umc-202hd-for-measurements.341309/ )
- Low pass filter on output R (giving me a very good sine etc... generator, with very clear/clean curves on my scope)
- Balanced input board (OPA1656, OPA1632, lightbulbs etc...) L input / Board accept an amplifier directly without voltage dividers.
- Phantom power disconnected
- Another mod on R input, giving also good results (direct in)
Well this thread is not a mod thread, just wanna tell the story short.
A sine to the balanced input typically looks like this :
This is with Victor's 1KHZ osc.
I use REW and i understand a lot of things which can be done with this excellent program.
Recently i had a conversation with Victor, and he gave me a schematic for a notch filter (1KHz)
I did a quick mockup, but having no box/enclosure yet, i get a lot of noise ofcause, but i did ran a measurement of it:
I have used a lot of time, understanding the use of this (Reading reading reading etc... 🙂 ), and so far i know that, the notch will filter everything out, except the 1KHz we are interested in sending to the DUT.
But when trying to send the 1KHz into the Behringer there are a lot of attenuation also.
I cannot figure out how i should use it.
- Should i create calibration file?
- Can it only be used with a lot of gain afterwards before sending it back into the Behringer
- Should i do trace arithmetic and then create calibration file
Also it will be some time until i get it packet up in a closed box, but i still wan't to learn in meantime.
Hope someone would explain to me, howto ?
Thank's all
Rgds; Jesper.
Please share the Notch Filter schematics.
Notch will remove the fundamental. It is Not-Notched combined with Notched via R.E.W.'s trace arithmetic + mic cal. file that gives the final clean FFT.
Notch will remove the fundamental. It is Not-Notched combined with Notched via R.E.W.'s trace arithmetic + mic cal. file that gives the final clean FFT.
I would have thought that notching Victor's output allows a soundcard's ADC to operate at very low signal levels, such that the ADC does not overtly introduce its own harmonics to swamp the harmonics present in Victor's output. All the harmonics shown in post 1,298 are from the soundcard ADC, not from Victor's oscillator.
- Home
- Design & Build
- Software Tools
- How to - Distortion Measurements with REW