That's what I would do. I don't have any personal experience with that interface, but did look it up.
Thanks everyone for the input (no pun intended), the problem turned out to be down to my mistake - I was either touching one of the leads of the cable or it was touching the PC case, in both cases I can see the distortion and noise. When I connected the divider properly with a new cable there was no distortion. Now I have to hook up the amp and try again.
@wtnh - I have a bridge amplifier to measure so I'll try the balanced divider you shown, but since my EMU1212 doesn't have Hi-Z inputs I presume I don't need to go as low as 100/1 divider. I can select -10dB (mono) or +4dB (balanced) inputs, and my amp puts out 32v max when feeding it 1khz at -3dB, so a 20/1 divider should be good.
@wtnh - I have a bridge amplifier to measure so I'll try the balanced divider you shown, but since my EMU1212 doesn't have Hi-Z inputs I presume I don't need to go as low as 100/1 divider. I can select -10dB (mono) or +4dB (balanced) inputs, and my amp puts out 32v max when feeding it 1khz at -3dB, so a 20/1 divider should be good.
That would probably work OK. Also, see my later post about using the XLR inputs. On the 0404, the XLR inputs by-pass the hi-z buffers, so you can get a slight improvement in THD. Not sure about the wiring on your interface, though.
What I can tell you, at least on the EMU 0404, is that the input levels have a huge effect on the lookback distortion and noise. I found the inputs were extremely sensitive and had to be kept at a minimum, plus the input level control, which is actually a gain control (not an attenuator) had to be set to a low value.
What I can tell you, at least on the EMU 0404, is that the input levels have a huge effect on the lookback distortion and noise. I found the inputs were extremely sensitive and had to be kept at a minimum, plus the input level control, which is actually a gain control (not an attenuator) had to be set to a low value.
Last edited:
Hi all
this is a very interesting thread...
Until now I used this Visual Analyser software
Visual Analyser
with a very cheap usb audio card.
Reading this thread I thought to buy a Focusrite Scarlett 2i2 or a Focusrite Scarlett Solo.
Because I want test both channel, I have some doubt about the Focusrite Solo. Is it possible to connect left and right input at the same time?
Are there quality difference (i.e. noise)?
Thanks
Oh, I'm sure it is my error - I just got the ADI and am not yet familiar with it.
The attached shows the setup; I'm using loopback cables on the rear of the ADI, Main outputs 1/2 into analog inputs.
On the ADI front panel the level is set at -6.0dB for Main Out 1/2 .
Any tips?
Jan
Hi Jan,
I just ordered one of these to use with my auto ranger mkII (which is great by the way)
The Scarlett 2i2 V3 THD20 is a little higher than I would like for measurement.
How did you go with the RME?
-Dan
Dan, I just got a new shoulder 2 weeks ago and still a bit handicapped with just one operational arm.
So this is on the back burner for the next several weeks ...
Jan
So this is on the back burner for the next several weeks ...
Jan
Hallo Jan,
I wish you a speedy and complete recovery !
Rotator Cuff ?
I had to have mine reconstructed 2.5 years ago - probability is good for complete usability again with this kind of operation.
All the best, Claas
I wish you a speedy and complete recovery !
Rotator Cuff ?
I had to have mine reconstructed 2.5 years ago - probability is good for complete usability again with this kind of operation.
All the best, Claas
Actually I got a complete new shoulder joint, both parts. They had to sever the tendon that attaches to the rotator cuff, as I understood, so I am pretty much immobilized on that side until the tendon has regrown enough to start serious revalidation.
Jan
Jan
First, my thanks to xrk971 and the rest of this community that makes diyAudio a place that keeps me coming back for more.
After weeks of frustration (and binning my original interface) I got a used Focusrite and was able to get some measurements. I'm attaching photos of my setup, plus an initial measurement for reference to my question:
When I press the red RTA button, the immediate response is not that great, but it improves after a few seconds... (which is what the snapshot shows) but the graph and distortion figures keep changing, (getting better) and if I wait a few more seconds, the graph gets these weird bumps instead of the spiky harmonics. When I reset the averages it goes back to a spikey harmonic graph, but appears to start the process over again... So how long do I wait to press the red button again and freeze the display? The distortion graph never seems to reach a stable reading.... is that normal, or do I have a wrong setting somewhere?
This graph is of my re-capped Carver 500 and hope to use that as a reference for measuring some new Chip and Discrete amps I have in the process of rebuilding...
Thanks! - Sixto.
Attachments
Hi Sixto,
Looks like you are getting there,
What sort of graph do you get with the dB setting on the top left set to dBFS or dBc ?
Are you getting low numbers and noise in loopback ?
-Dan
Looks like you are getting there,
What sort of graph do you get with the dB setting on the top left set to dBFS or dBc ?
Are you getting low numbers and noise in loopback ?
-Dan
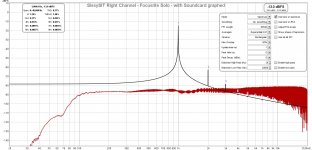
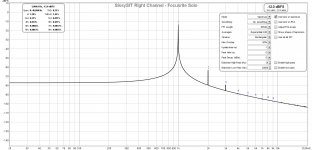
I finally got my Focusrite set up and began with a test on my SissySIT, an F5, Aleph J, and a couple other amps. It's really nice to see the distortion and harmonics, and will be great to tune the P3 on F5 amps using this rig.
When I compare the graphs I'm seeing with what is posted I'm curious why the noise floor up to 1k is at -80dB range, then it trails down up to 20k. It's the same story with all the amps, and even when I switch between Focusrite and Akitika generating the 1kHz wave. The pix I'm seeing in this thread have a more consistent noise floor and more "grass" at the bottom.
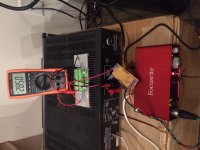
I have some pix of my bench set up and some SissySIT screen shots.
I'm running the PC on battery mode. The power resistor board has a little voltage divider network on it that feeds into the XLR input of the Focusrite.
Any tips to share?
When I compare the graphs I'm seeing with what is posted I'm curious why the noise floor up to 1k is at -80dB range, then it trails down up to 20k. It's the same story with all the amps, and even when I switch between Focusrite and Akitika generating the 1kHz wave. The pix I'm seeing in this thread have a more consistent noise floor and more "grass" at the bottom.
I have some pix of my bench set up and some SissySIT screen shots.
I'm running the PC on battery mode. The power resistor board has a little voltage divider network on it that feeds into the XLR input of the Focusrite.
Any tips to share?
Attachments

Hi Sixto,
Looks like you are getting there,
What sort of graph do you get with the dB setting on the top left set to dBFS or dBc ?
Are you getting low numbers and noise in loopback ?
-Dan
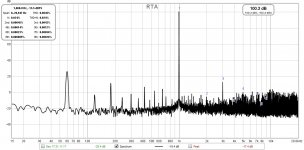
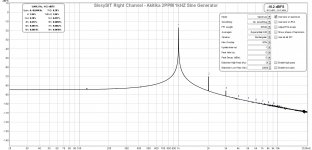
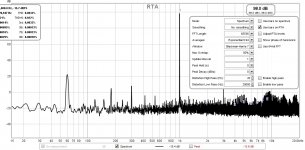
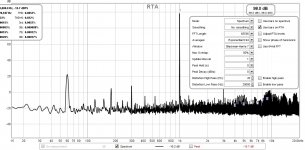
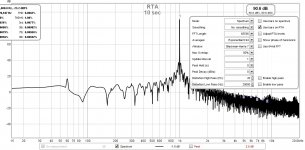
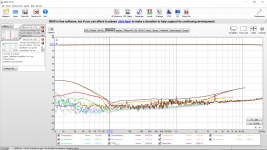
Hi Dan, I am relatively new to REW, so I've just been following the settings on the first post, here are 3 different images of the same signal, taken at 10, 20 and 30 seconds after hitting the RTA red button.
I don't see the settings you mention to change dB to dBFS or dBc... I also don't know if I'm getting noise in Loopback - I ran the sound-card calibration and created a calibration file, just like I had from the mike... I thought that would offset the noise from the soundcard and what RTA shows should be just the amp noise...
I did try running RTA with various averages, various window types etc... I still keep getting distortion numbers that get lower with time.(and change values when I change settings) ..though the rate of change seems to slow. (the longer I wait the lower distortion I get...and there is more change from 0-10 sec. than from 20 to 30 sec. (even after hitting the reset average button...)
Maybe this is the way it's supposed to work, I just thought that I would get a steady, repeatable number.
Thanks! - Sixto.
Attachments
I don't pretend to understand much about digital processing. Here is something I found online:
Practical Test & Measurement: Sound Cards for Data Acquisition in Audio Measurements (Part 5) - The User | audioXpress
As far as my limited understanding of what is happening, in FFT analysis samples of the signal is analyzed. Averaging over time increases the signal to noise ratio and decreases the random fluctuation in the measurement. The sampling rate is finite, and depends on the program settings and maximum sampling rate of the sound card, and processor speed of the computer. So averaging over time improves the measurement.
If you change "Averages" in REW to "None", you will see constant fluctations in the distortion profile.
To choose dBFS, hover your mouse pointer over the upper left corner of the screen and a pull down menu will appear.
Hi Dan, I am relatively new to REW, so I've just been following the settings on the first post, here are 3 different images of the same signal, taken at 10, 20 and 30 seconds after hitting the RTA red button.
I don't see the settings you mention to change dB to dBFS or dBc... I also don't know if I'm getting noise in Loopback - I ran the sound-card calibration and created a calibration file, just like I had from the mike... I thought that would offset the noise from the soundcard and what RTA shows should be just the amp noise...
I did try running RTA with various averages, various window types etc... I still keep getting distortion numbers that get lower with time.(and change values when I change settings) ..though the rate of change seems to slow. (the longer I wait the lower distortion I get...and there is more change from 0-10 sec. than from 20 to 30 sec. (even after hitting the reset average button...)
Maybe this is the way it's supposed to work, I just thought that I would get a steady, repeatable number.
Thanks! - Sixto.
Hi Sixto,
- Ben Mah's comments are correct about how to select dBc etc.
Your last graph looks pretty typical, so you can see the (US) 60 Hz mains noise spike which is significantly higher than your THD by the looks of it.
Also once you set your input level your level you can do a stepped sine measurement so you can see THD at frequencies other than 1 kHz. REW will automatically measure at your selected frequency steps.
Just a tip - prior to stepped sine **check the level is the same as the generator tab**
REW will then give you a graph of THD across the full audio spectrum as long as your ASIO or JAVA driver settings and sample rate in the preferences are at a high enough sample rate and you have selected the appropriate settings to cover the audio spectrum in the stepped sine tab.
(REW will usually give you a message pop up if the setting are not suitable.)
I hope this helps.
- Dan
It isn't. You may be getting a dropout that is corrupting a measurement. If you are using ASIO make sure the buffer size is set to something large, small buffers (or low latency if labelled that way) are more prone to dropout. Also beware of WiFi, which can sometimes cause interference, or heavy background activity from another application or process.Maybe this is the way it's supposed to work
I did my first power amplifier distortion measurements today and I obtained good results at 100 Hz and 1 kHz (inline with what I would expect from the datasheet).
The amplifier is the uPC1342V with two pairs of 2SC5200/2S1943.
However I get high distortion at 20 Hz. (Especially 3rd harmonic.) What would cause that? Is a capacitor too small in the circuit? Or it is something to do with the measurement or setup of REW?
I have attached images and a picture of the amplifier.
The sweep (with screen shots at 20/100/1000 Hz) are at 12 Vrms into 4 Ohms.
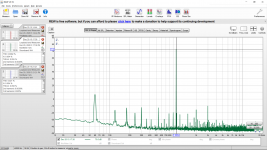
The spectrum (1 kHz) is at 8 Vrms into 4 Ohms:
65536-point spectrum using Blackman-Harris 7 window and exponential averaging 0.94
Input RMS 72.6 dB, 72.6 dBC, 72.6 dBA
Distortion at 999.8 Hz, -13.9 dBFS based on 8 harmonics:
THD: 0.0082 %
N: 0.054 %
THD+N: 0.055 %
2nd harmonic 0.0038%
3rd harmonic 0.0072%
4th harmonic 0.00080%
5th harmonic 0.00068%
6th harmonic 0.00022%
7th harmonic 0.00019%
8th harmonic 0.00019%
9th harmonic 0.00018%
As an aside I get 3x higher 3rd harmonic if I do not short the fast blow fuse in the speaker lines (my disaster fuse while testing project amplifiers).
The amplifier is the uPC1342V with two pairs of 2SC5200/2S1943.
However I get high distortion at 20 Hz. (Especially 3rd harmonic.) What would cause that? Is a capacitor too small in the circuit? Or it is something to do with the measurement or setup of REW?
I have attached images and a picture of the amplifier.
The sweep (with screen shots at 20/100/1000 Hz) are at 12 Vrms into 4 Ohms.
The spectrum (1 kHz) is at 8 Vrms into 4 Ohms:
65536-point spectrum using Blackman-Harris 7 window and exponential averaging 0.94
Input RMS 72.6 dB, 72.6 dBC, 72.6 dBA
Distortion at 999.8 Hz, -13.9 dBFS based on 8 harmonics:
THD: 0.0082 %
N: 0.054 %
THD+N: 0.055 %
2nd harmonic 0.0038%
3rd harmonic 0.0072%
4th harmonic 0.00080%
5th harmonic 0.00068%
6th harmonic 0.00022%
7th harmonic 0.00019%
8th harmonic 0.00019%
9th harmonic 0.00018%
As an aside I get 3x higher 3rd harmonic if I do not short the fast blow fuse in the speaker lines (my disaster fuse while testing project amplifiers).
Attachments
-
 Second Style uPC1342V Kit First Test.jpg997.5 KB · Views: 252
 -
 20 Hz 12 Vrms into 4 Ohms uPC1342V.png461 KB · Views: 253
 -
 100 Hz 12 Vrms into 4 Ohms uPC1342V.png483.5 KB · Views: 224
 -
 1000 Hz 12 Vrms into 4 Ohms uPC1342V.png459.2 KB · Views: 190
 -
 THD 2nd Design uPC1342V 4Ohms 8VRMS Upper Removed Speaker Fuse.png337.5 KB · Views: 217
- Home
- Design & Build
- Software Tools
- How to - Distortion Measurements with REW