Methodology
Factory open space setting. Nothing within 6m of horn front
Topping D10s -> MC2 T4 250 -> UMIK1
Topping D10s USB DAC and Bridge Review | Audio Science Review (ASR) Forum
mic 2.5m on axis from baffle front
first measure ~80db peak
EQ flat to 2db using REW EQ helper
adjust with Equaliser APO
check and adjust volume to 80db peak
perform final test sweeps and create relevant charts
Last edited:
it will be interesting to see what xo-point you will find sounds best. I tend to prefer as low as possible, probably because the acoustic centers are rather far apart.
I'm also curious to see the frequency response you end up aiming for. A linear response sounds terrible on my setup, but i wonder if measuring distance is a bigger factor than i thought on horns. I adjust mine at 1m. I pretty much follow the x-curve discussed in the link you provided. We use the same mic, so thats great for comparison.
I'm also curious to see the frequency response you end up aiming for. A linear response sounds terrible on my setup, but i wonder if measuring distance is a bigger factor than i thought on horns. I adjust mine at 1m. I pretty much follow the x-curve discussed in the link you provided. We use the same mic, so thats great for comparison.
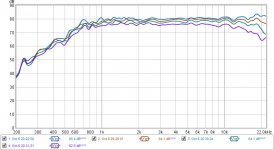
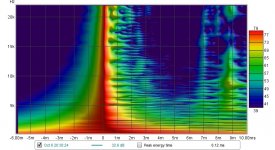
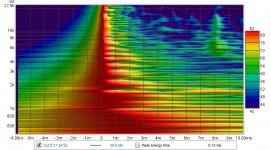
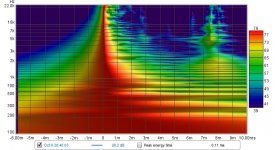
In order 0,15,30,45
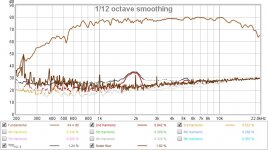
All spl with 1/12th smoothing at 0,15,30,45.
All spl with 1/12th smoothing at 0,15,30,45.
Attachments
-
 0 dist on axis.jpg101.5 KB · Views: 505
 -
 all spl 15 deg increments 12th smoothing.jpg80.7 KB · Views: 234
 -
 45 spec on axis.jpg124.7 KB · Views: 171
 -
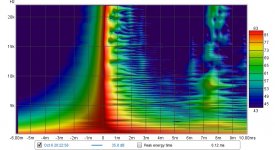
 45 dist on axis.jpg103.1 KB · Views: 168
 -
 30 spec on axis.jpg120.6 KB · Views: 170
 -
 30 dist on axis.jpg102.4 KB · Views: 468
 -
 15 spec on axis.jpg117.4 KB · Views: 478
 -
 15 dist on axis.jpg99.6 KB · Views: 469
 -
 0 spec on axis.jpg117.1 KB · Views: 504
Last edited:
5m on axis butterworth 800hz/24db.
Attachments

Last edited:
At 800 using BW 24dB - seems OK so far. Bear in mind I'm sat in a cold warehouse right now though. Cathedral reverb going on.
I hope to finish the "LineSource" inspired "clever" cabinet this week so the 12P80ND has a f3 of 80 to 100.
I hope to finish the "LineSource" inspired "clever" cabinet this week so the 12P80ND has a f3 of 80 to 100.
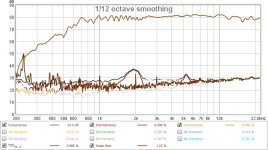
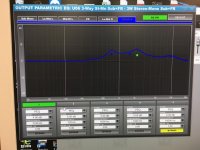
2.5m on axis complete speaker. The 12p80 is "open baffle" here and four EQs used to flatten as best I could manually. REW EQ helper needs a little more time spent with it.
Attachments

incredible off-axis response! Properly controlled dispersion indeed. Good job! Harmonic distortion looks very low at these levels at least. I'm curious if intermodular distortion could be an issue, but i don't know how to measure that.
Last edited:
It was four EQ, sorry. This was a quick and dirty to smooth it out by eye the the charts you see in post #63 HF10AK + 12P80ND + custom WG
720 +5dB Q5.0
1600 +5dB Q0.8
2180 +4dB Q4.0
9300 +3dB Q3.0
720 +5dB Q5.0
1600 +5dB Q0.8
2180 +4dB Q4.0
9300 +3dB Q3.0
Attachments
Last edited:
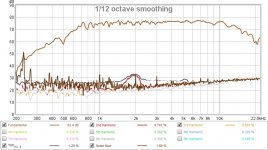
yeah maybe 2k H2 rise comes from eq'ing maybe acoustic problem?
Or diaphgram has null.
i would not go under 2k with this driver
Or diaphgram has null.
i would not go under 2k with this driver
Last edited:
For domestic “hifi” use the HF10AK seems to be often used lower than that. I’ve read several reports being fine at 800 BW 18/24 slopes. The 2K dip/droop is a known drop with this Faital.
Last edited:
Thnaks Charles - I'm looking for some comparison charts on here now. Is that region due to the HF10AK impedance curve? Or acrylic painted MDF waveguide? Or waveguide shape?
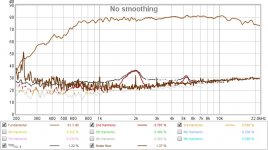
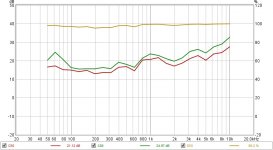
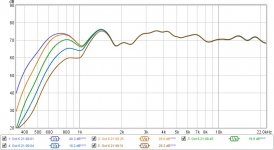
Additional test at 70dBSPL, on axis, no EQ.
BW 24dB highpass at 400/600/800/1000/1200
BW 24dB highpass at 400/600/800/1000/1200
Attachments
Last edited:
Right.
1). set the SPL to 104 dB at 1 m using a pink noise.
2). measure the distortion with UMIK placed 10 cm from the waveguide mouth
1). set the SPL to 104 dB at 1 m using a pink noise.
2). measure the distortion with UMIK placed 10 cm from the waveguide mouth
yeah hard to say what input volts really are.
"For the remaining series of tests, I set up the Listen, Inc. AudioConnect analyzer and 1/4” SCM microphone (provided by Listen, Inc.) to measure distortion and generate time-frequency plots. For the distortion measurement, I mounted the Oberton ND45/H-960 combination in free-air in the same manner as was used for the frequency response measurements, and set the SPL to 104 dB at 1 m (2.83 V determined by using a pink noise stimulus generator and internal SLM in the SoundCheck 17 software). Then, I measured the distortion with the Listen microphone placed 10 cm from the mouth of the horn. This produced the distortion curves shown in Figure 10."
2.83V?
what i've read they have been between 0.5V and 4volts
- Home
- Loudspeakers
- Multi-Way
- HF10AK + 12P80ND + custom WG