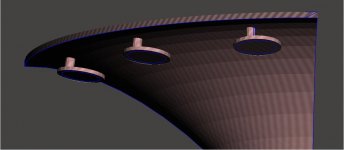
I deleted my rear chamber; reduced the interface to a disk, and un-colored my drive elelmen, checked normals on it (which were correct) and now I have same response shape. Try as I might, I can't rotate the drawing to the same viewpoint as yours.

I really should redraw the chamber in fusion360 but what I want to do first is abec the rim array as drive element. I did find a missing face in the chamber when I edited which could account for the "funkiness". Not entirely sure that missing face wasn't a consequence of the edits as I didn't notice it right away.
I really should redraw the chamber in fusion360 but what I want to do first is abec the rim array as drive element. I did find a missing face in the chamber when I edited which could account for the "funkiness". Not entirely sure that missing face wasn't a consequence of the edits as I didn't notice it right away.
Attachments
Last edited:
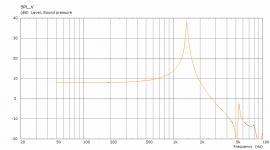
I've got what appears to be a good simulation with the rim array driving and the throat closed off. I'll just show the graph without comment for now except to say that if a fly isn't found in the ointment, I will take the approach as viable and move on to putting a system simulation together in Vituix. My previous Vituix work had the rim array playing 400 Hz to 800 Hz
Attachments

I'll just show the graph without comment for now except to say that if a fly isn't found in the ointment, I will take the approach as viable and move on to putting a system simulation together in Vituix. My previous Vituix work had the rim array playing 400 Hz to 800 Hz
There is something higher in frequency that isn't quite right but in the region of interest it looks good so I would go with it.
To get the data into Vituix use the polar curve graphs for H and V and select all the curves if an observation script for -90 to +90 was used (37 curves). Select them all in the legend and export the data as text level and phase.
Name them as Something_Hor_ or Something_Ver_ ABEC will add a number at the end.
Then use my advanced renamer script (program is a free download for windows) Acoustic Horn Design – The Easy Way (Ath4) to change the ABEC number into the correct value for use with Vituix.
Watch the normalization in the Observation script to make sure it is set as you intend or change it afterwards in VACS before export.
Reposting hoping moderators will delete the previous two posts
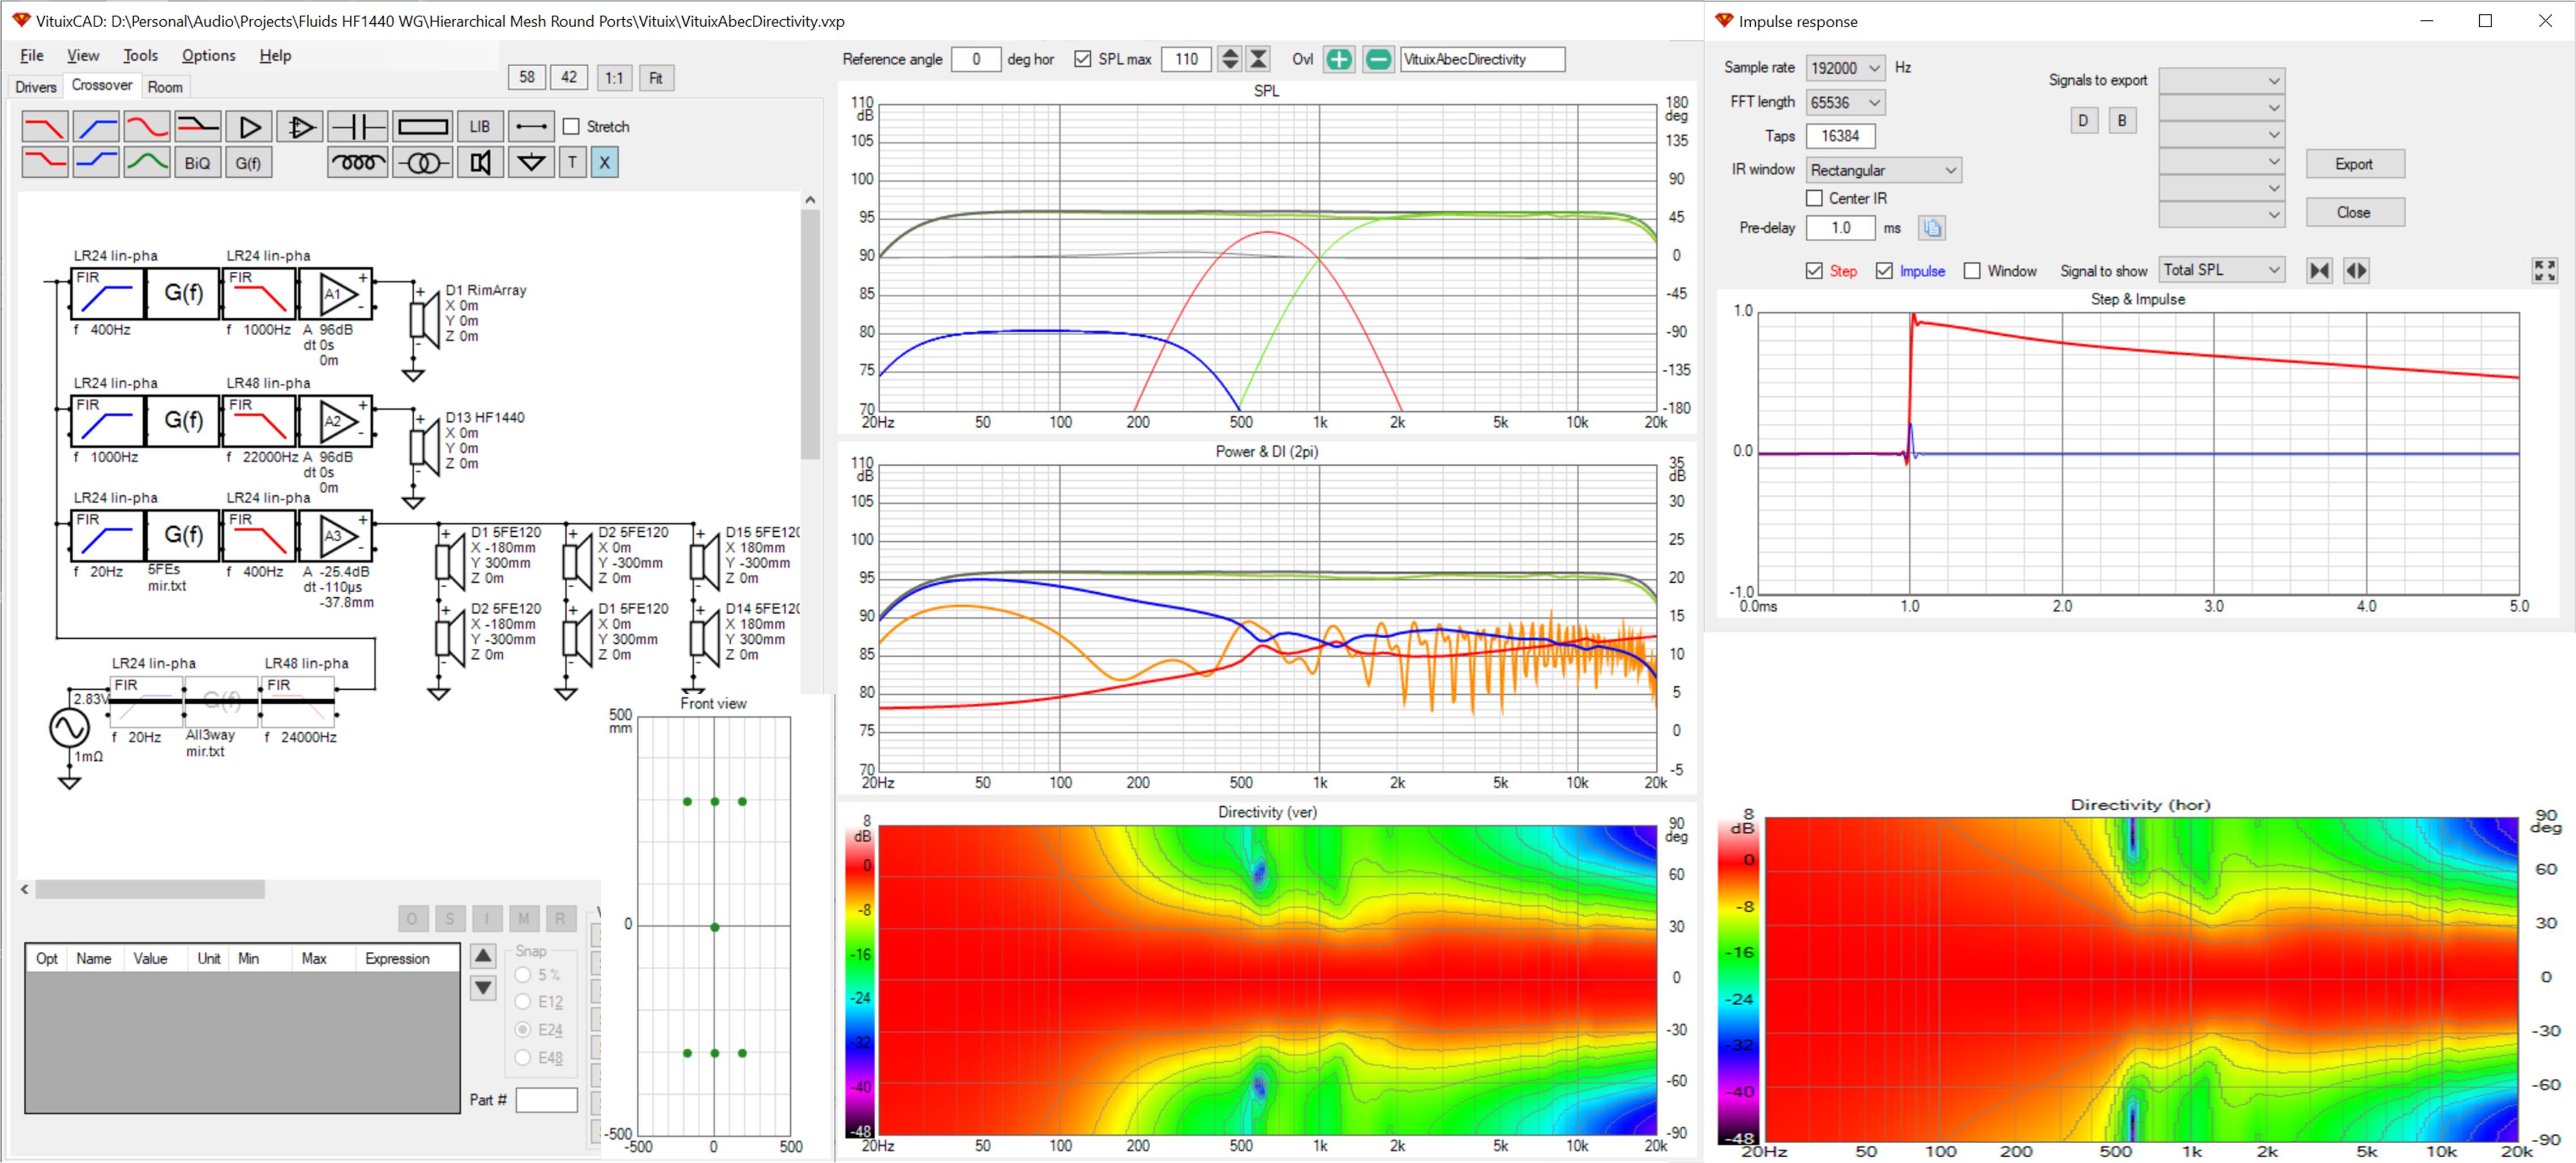
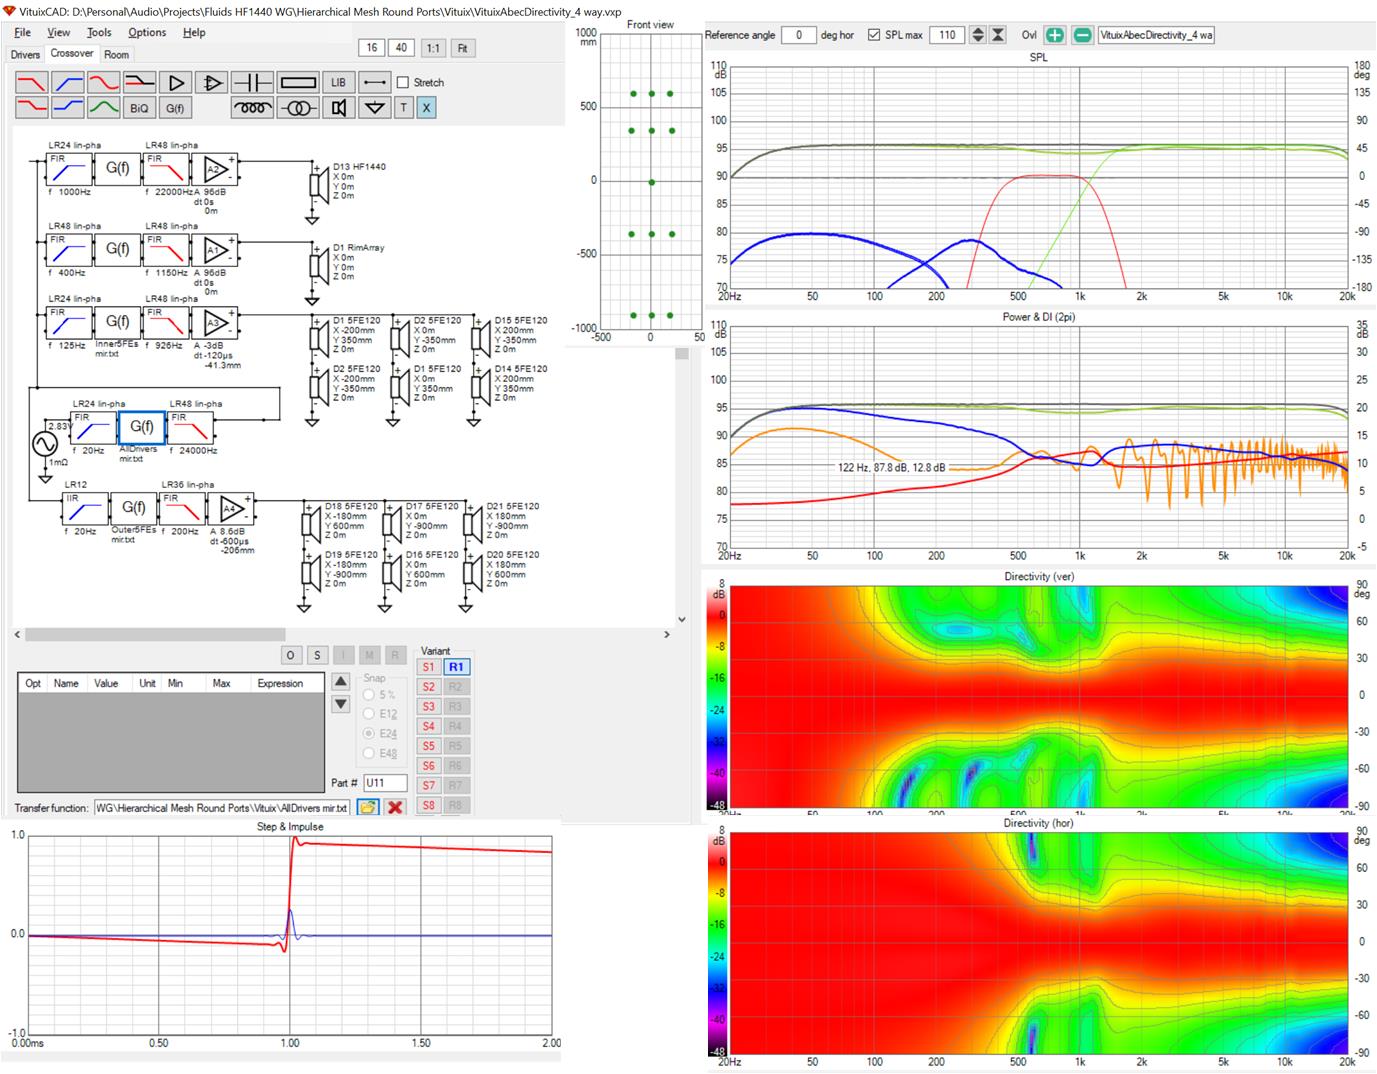
I did a Vituix simulation of the waveguide and rim array with rows of 5" midwoofers just above and below the array, using linear phase LR4 crossovers with impulse inversion equalization on each set of drivers. The results show vertical pattern control below 200 Hz and horizontal pattern control extended to 500Hz. The 20 Hz low corner shown in the simulation is un-realistic; one needs subs or another way with perhaps 6 more 5FE120s.
The room response curve includes just floor and ceiling reflections. The 30 degree vertical pattern doesn't eliminate them! In a corner toed in 45 degrees, there would be little contribution from the sidewalls other than bass support.
Attachments

I'm doing it and it suffers 200-500 Hz. Earlier versions I needed to have overlap in the XO to minimize that.
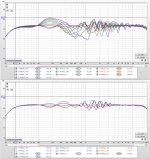
I added that 4th way, played with XOs and overlap purposely narrowing vertical pattern in sensitive 400 Hz to 1.3 khz region to reduce ground sensitivity. Here are the results:
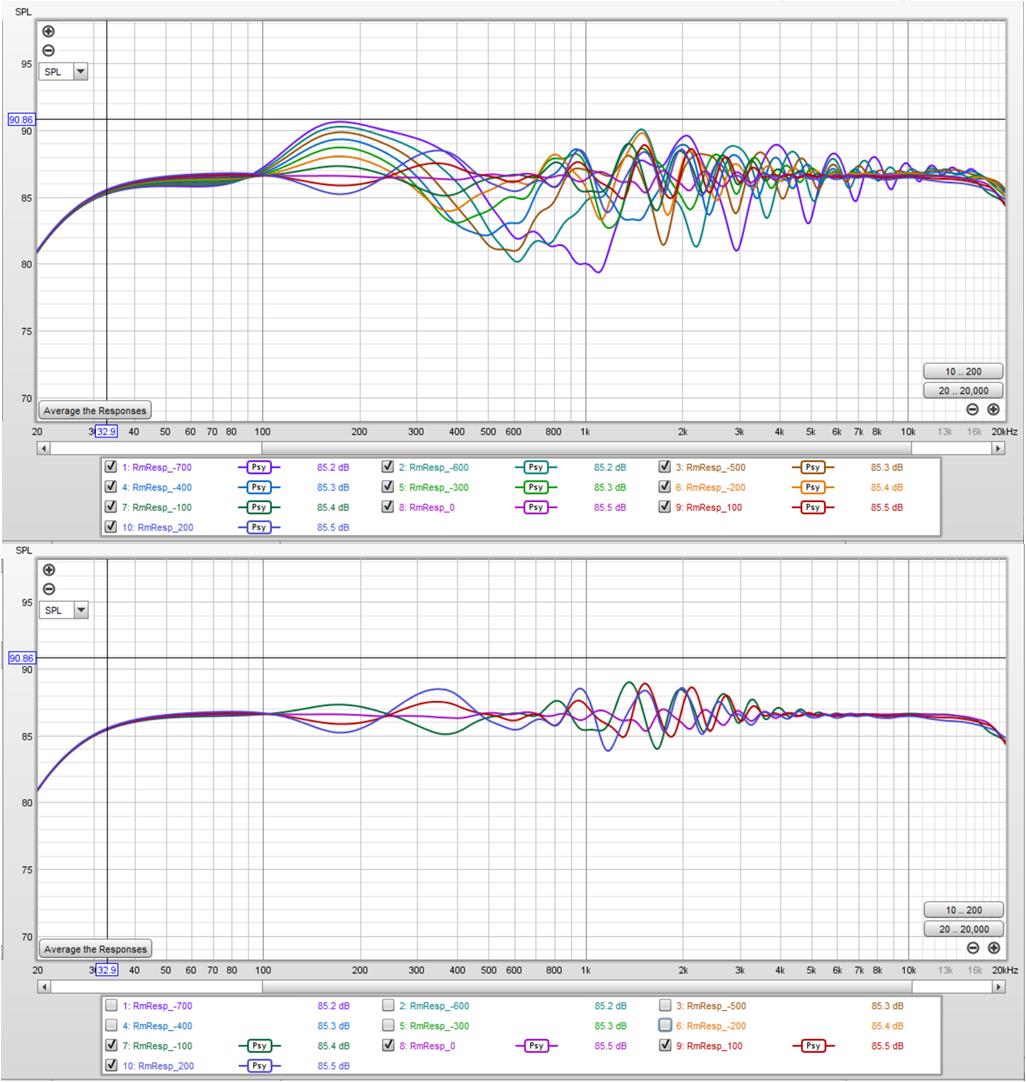
The lower group is seated range, for me 1m -200, +100mm. Notice that the worst deviation is around 1.2 khz where the wg is starting to widen.
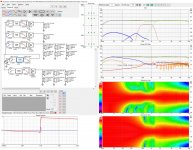
Here is what the results come from:
The lower group is seated range, for me 1m -200, +100mm. Notice that the worst deviation is around 1.2 khz where the wg is starting to widen.
Here is what the results come from:
Attachments
Prior to the abec, I had done a Vituix sim of 12 drivers on the same 210 mm radius
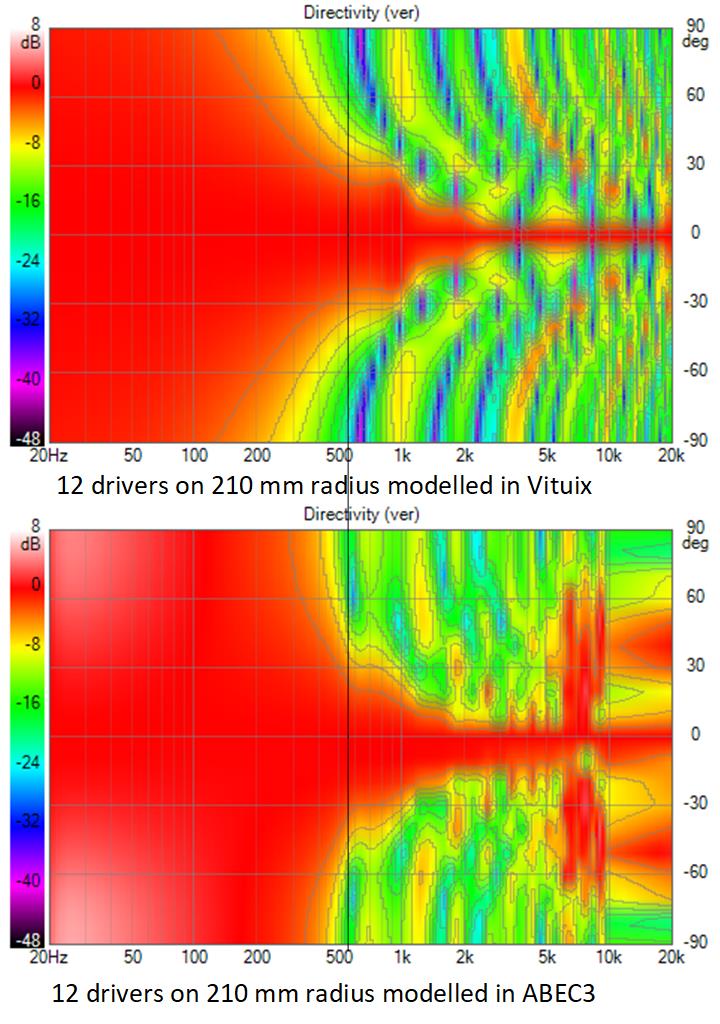
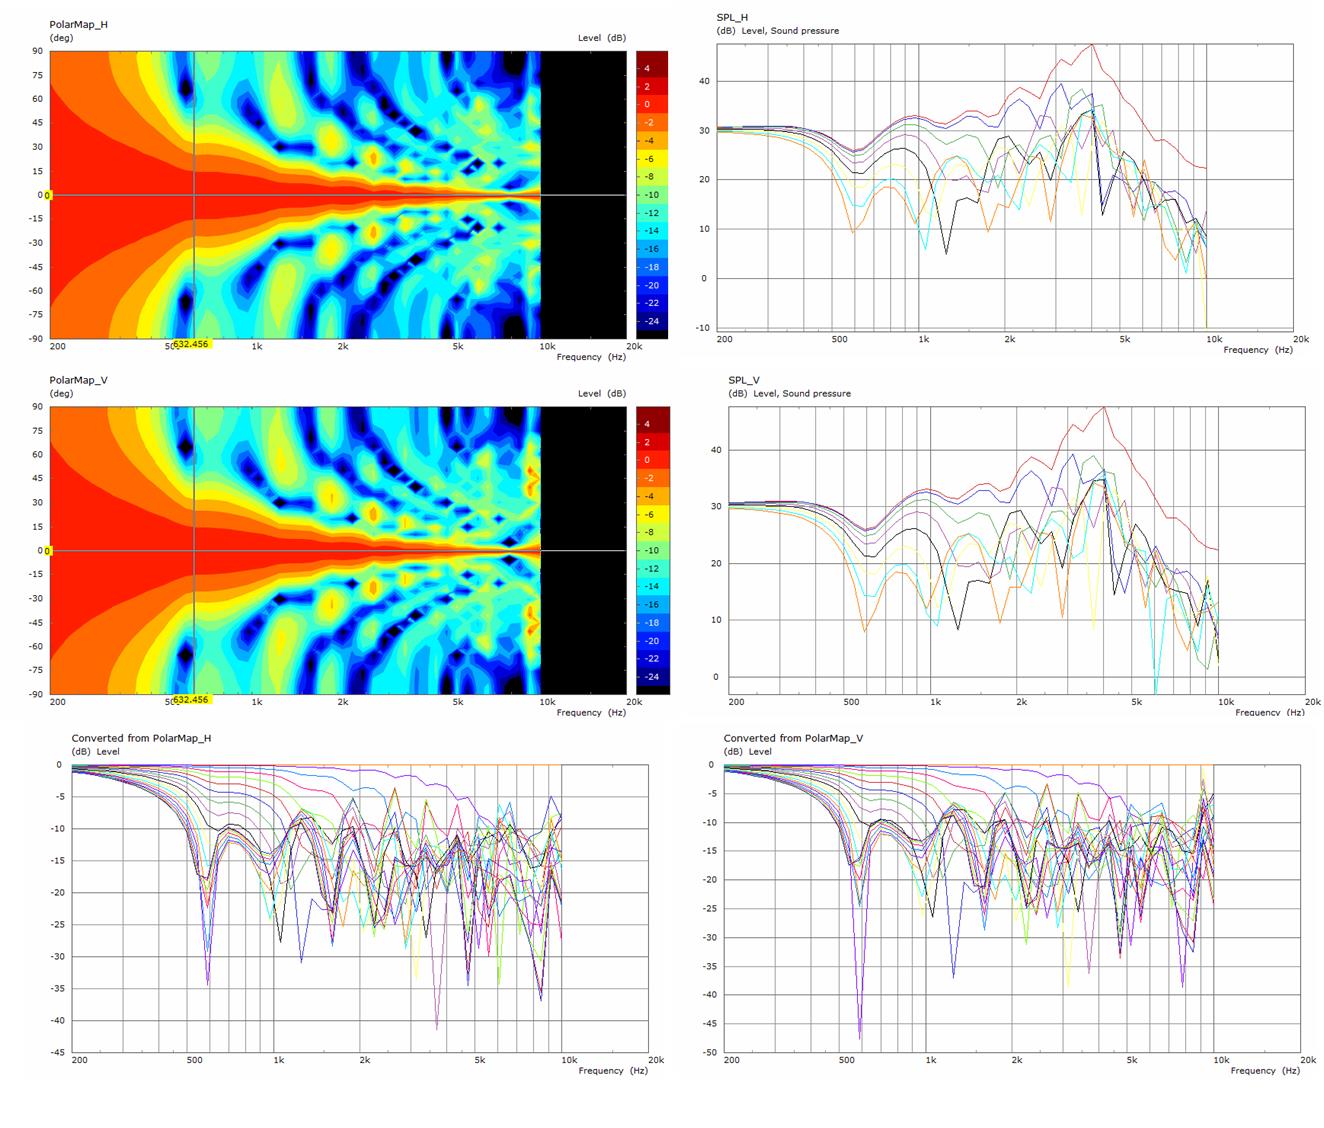
These plots are for the rim array alone. Vituix predicts a more gradual loss of pattern control below 500 hz. ABEC shows gradual loss below 1 khz, then sharp loss below 500 Hz. I wonder how many frequencies Vituix calculated between 200 and 500 Hz and if I should repeat the simulation with more frequencies there. This is a critical region for my system design.
These plots are for the rim array alone. Vituix predicts a more gradual loss of pattern control below 500 hz. ABEC shows gradual loss below 1 khz, then sharp loss below 500 Hz. I wonder how many frequencies Vituix calculated between 200 and 500 Hz and if I should repeat the simulation with more frequencies there. This is a critical region for my system design.
Attachments
When I put all the FRs in a single REW all SPL. the positive angle traces land right on top of the negative angle traces. Likely something in Vituix.
I assume this is the directivity plot from ABEC, the 12 driver imported as one driver at point zero? As ABEC had already figured out the pattern of that array, right?
At least that's what I see in the schematic as well. Strange that its bent out of shape like that (drooping down), as it looked alright in ABEC.
At least that's what I see in the schematic as well. Strange that its bent out of shape like that (drooping down), as it looked alright in ABEC.
All the data from ABEC was normalized when exported the way I described, it won't be easy to undo that and could be misinterpreted when trying to do so.
The polar data can be plotted in VACS without normalization and equalization done in Vituix.
The polar data can be plotted in VACS without normalization and equalization done in Vituix.
even when all drivers are turned off, these un-normalized plots show whatever is down in the mud so I'm not terribly concerned about that little bit of asymmetry; I'm more interested in eliminating the sidelobes around 500 hz. I don't think getting un-normalized data from abec would help in any case.
- Home
- Loudspeakers
- Full Range
- Full range line array for wall or corner placement