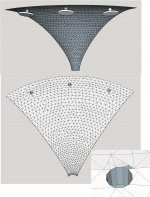
I didn't get anywhere until I redrew my ports and bandpass chambers onto the back of the HF1440.msh contributed by @fluid. Then I had to get past a couple of misconceptions, then I finally got what appears to be a good run, results attached below.
Its too early to comment on them until I get a good run of the waveguide without the ports and chambers added for comparison. ABEC has been resisting me as I knew it would... I know what my mistake has been so the next try should get it!
Its too early to comment on them until I get a good run of the waveguide without the ports and chambers added for comparison. ABEC has been resisting me as I knew it would... I know what my mistake has been so the next try should get it!
Attachments

Are those results in an Infinite Baffle with an interface at the mouth junction?
Either way you are making progress 🙂
In VACS you can change the range values to have the graph fit better based on the frequency range, and also the level of detail in the polar can be increased.
By right clicking on the graph and selecting range
X axis can adjust the frequency range to fit
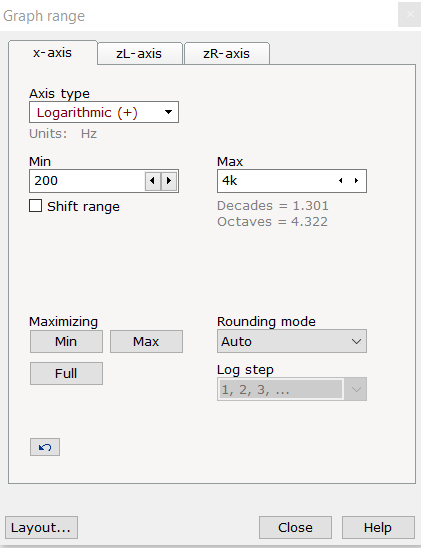
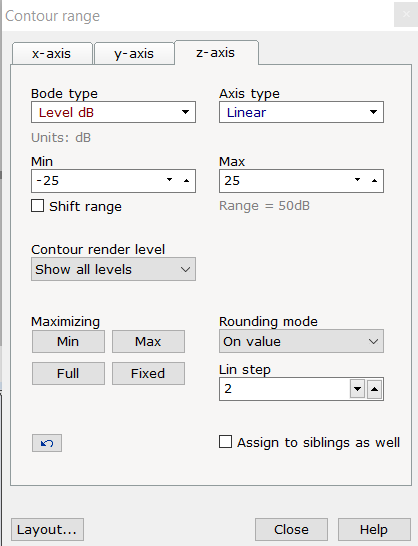
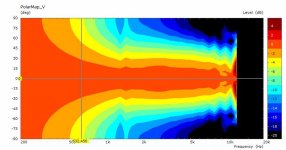
And on the polar the z axis can be changed to show a finer range, change the rounding to On value and either 2 or 3 in the box as shown to get a finer polar. A 5dB change between colours hides a lot of information.
Either way you are making progress 🙂
In VACS you can change the range values to have the graph fit better based on the frequency range, and also the level of detail in the polar can be increased.
By right clicking on the graph and selecting range
X axis can adjust the frequency range to fit
And on the polar the z axis can be changed to show a finer range, change the rounding to On value and either 2 or 3 in the box as shown to get a finer polar. A 5dB change between colours hides a lot of information.
Attachments

Thanks. That was on my todo list.
The waveguide without the ports came out clean.
Let me replot those curves.

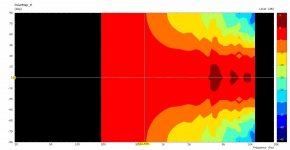
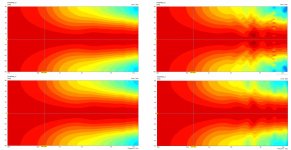
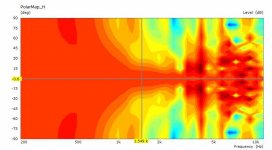
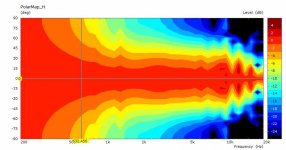
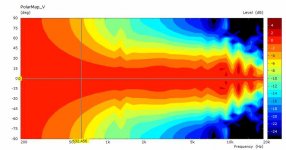
Well, its good for on axis and the first step off, which IIRC is 7.5 degrees
those are 2 db steps between color shades, so its not terrible further out; but I would definitely like to make it better...
The waveguide without the ports came out clean.
Let me replot those curves.
Well, its good for on axis and the first step off, which IIRC is 7.5 degrees
those are 2 db steps between color shades, so its not terrible further out; but I would definitely like to make it better...
Attachments
Out of curiosity, try 3 even smaller holes with the same total area as the current hole per driver....
(which would be similar to what the holes Patrick Bateman used)
Ideally one would make the distance from throat to each of the three holes slightly different...
(which would be similar to what the holes Patrick Bateman used)
Ideally one would make the distance from throat to each of the three holes slightly different...
Last edited:
I'm trying for a 3 or 4 mm wide slit. The hole was 8 mm dia so if I don't go that narrow, I haven't gained much. Any narrower and it will be difficult to print.
I have to draw from the driver's chamber down and intersect that with the wg and then patch the wg stl at the intersections. Trying to draw the slit on the wg surface and extend upwards wasn't working.
I have to draw from the driver's chamber down and intersect that with the wg and then patch the wg stl at the intersections. Trying to draw the slit on the wg surface and extend upwards wasn't working.
The multiple holes at slightly different spaces/places would average out the effects all of the holes at the same spot. A series of slits wouldn't have that benefit. 😉
The guide is axisymmetric and the holes should keep it that way but there is a difference between H and V with V having less numerical instability. I think this is a mesh problem, and could be due to patching after cutting. In a previous image the vertices of the port did not seem to meet exactly at the waveguide surface which can cause this.Well, its good for on axis and the first step off, which IIRC is 7.5 degrees
those are 2 db steps between color shades, so its not terrible further out; but I would definitely like to make it better...
each of the 3 holes per quadrant intersects with the mesh differently and the patching was difficult on one of them.
The multiple holes at slightly different spaces/places would average out the effects all of the holes at the same spot. A series of slits wouldn't have that benefit. 😉[/QUOTE
The benefit I hope the slits will have is that most of the spectrum will pass over them as if they weren't there because their width will be a small fraction of the wavelengths; witness Genelec.
The slits were not so good (understatement). They have some awful sidelobes.
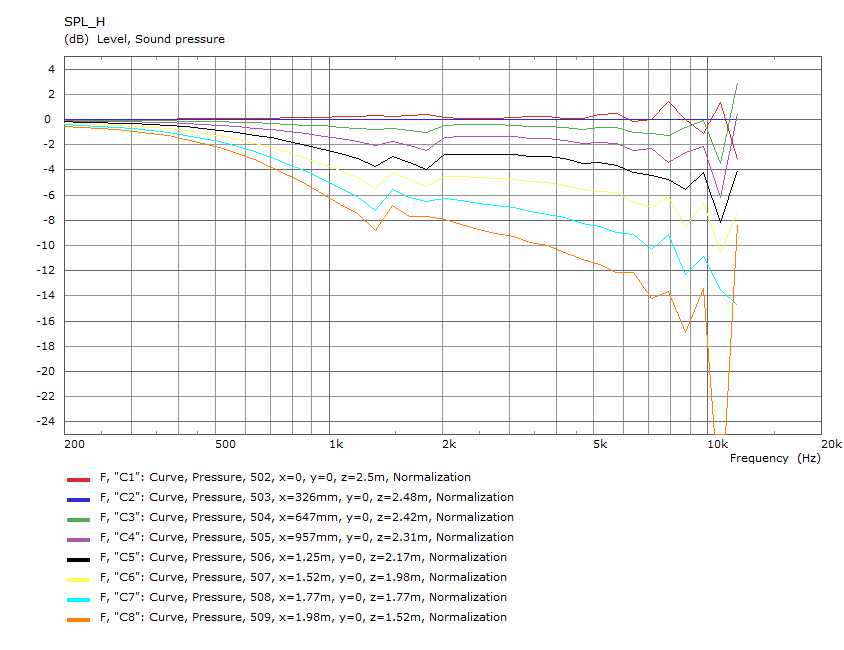
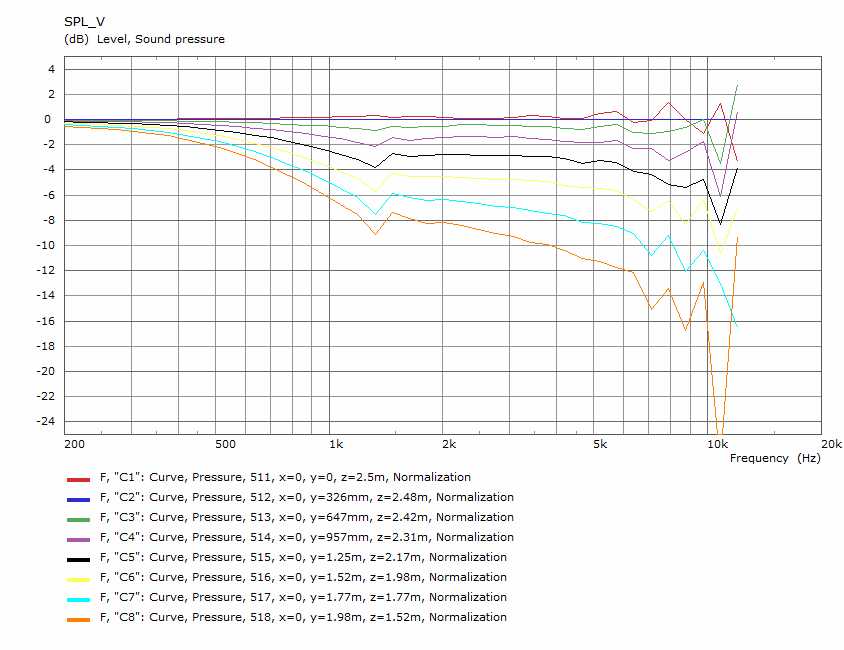
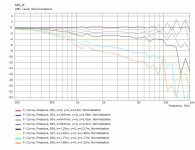
It would be good to understand what it is about the slits or my rendering of them that made it so bad but first I went back to the round ports. Perhaps they aren't so bad after all.
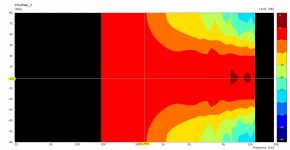
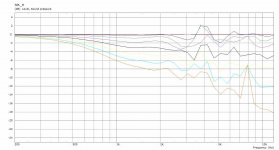
This time I normalized them and saw they are within +/- 2 db for a good distance off axis

Can these be improved? Let's try just closing off one port per quadrant, reducing number of drivers from 12 to 8.
It would be good to understand what it is about the slits or my rendering of them that made it so bad but first I went back to the round ports. Perhaps they aren't so bad after all.
This time I normalized them and saw they are within +/- 2 db for a good distance off axis
Can these be improved? Let's try just closing off one port per quadrant, reducing number of drivers from 12 to 8.
Attachments

Above 2K there is numerical instability making the results unreliable. It could be due to the semi random edge lengths that come from meshing to stl.
If you can try to export to step and use gmesh to see what it can do.
If you can try to export to step and use gmesh to see what it can do.
well 8 round ports is pretty much the same as 12 round ports so no point in posting the pictures. If the number of holes doesn't matter, more smaller holes might be better. Puttiing several smaller holes within the driver's cone's footprint is a possibility. There was one thread that showed that cutting them through at a grazing angle to the WG surface helped But I should understand the meshing and numerical instability issues better before going there.
My base waveguide is the original mesh from fluid, only the port additions are done in and STL-meshed by Sketchup. I should point out that I need to set Meshing=Delaunay to get ABEC to work; else it errors out in the meshing stage.
GMSH can read my STL files and apparently meshes them differently without any direction from me, which I don't know how to give. I have yet to find a viable STP export option for SK.
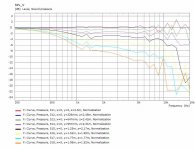
Look at the SPL graphs you posted in #1043 and see the difference between H and V. The V has a little bit that would be more accurate with more frequencies being used but the H is very spiky with sawtooth patterns and peaks and dips at the same frequency that don't make sense.how does one detect/recognize numerical instability?
If you double the number of frequencies being simulated and it still looks like that then you know the data is unreliable. It will take twice as long to do the sim though.
It does seem that sketchup won't export to step because it is a polygon mesh modeler.
I know you don't like new tricks but I would seriously consider trading sketchup for Fusion360 at least for this task. It will be different for sure but I have found it the easiest program to pick up and there are lots of videos and tutorials.
Getting the CAD drawing and meshing right is the most time consuming and difficult part of simulating with ABEC.
I think you are right about needing to go away from Sketchup. I only got this far because I had a decent mesh to hack, but I have one more hack in me...
I've been attempting to clean up the stl meshes I've been using and each iteration has produced incrementally improved results. The differences between H and V polar maps remain as does the prominent as does the prominent +/- 2db or so ripple around 4 khz, even if smaller. I increased mesh frequency to 2000 and this didn't change. I exported this mesh and even it had issues - one port had leakage around it. Because of this, I don't know how much of the deviations in the results are due to the mesh issues vs the ports in the waveguides.
During one of these runs, I watched a Fusion360 tutorial. I should be able to pick it up because once you learn the user interface a lot is same/similar to SK. BTW, I knew this was inevitable; I downloaded Fusion last week but I was in a hurry to see some abec results.
I've imported STL into Fusion. I can strip that down to the profile and rotate it to get a smooth surface based on a piecewise continuous curve. ...
I found an STL export issue. My exports from my smooth surface sketchup model have not been working. That is why I switched to editing stl. After frustration with that I went back to the smooth surface model and had learned enough by then to realize it was an export issue. Working around that with a different export tool, I got surprisingly good results which I will now post:

It looks like I may be running out of mesh resolution at 8 khz. Mesh frequency was 2000; I'm now rerunning with mesh frequency =4000 but it may be the underlying SK model doesn't have enough resolution, which I can fix by re-spinning the profile on a more finely divided circle...or moving to fusion
It looks like I may be running out of mesh resolution at 8 khz. Mesh frequency was 2000; I'm now rerunning with mesh frequency =4000 but it may be the underlying SK model doesn't have enough resolution, which I can fix by re-spinning the profile on a more finely divided circle...or moving to fusion
Attachments

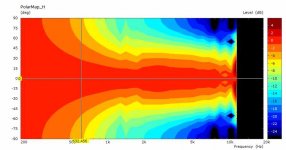
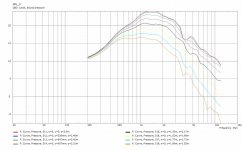
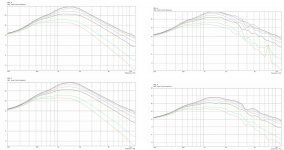
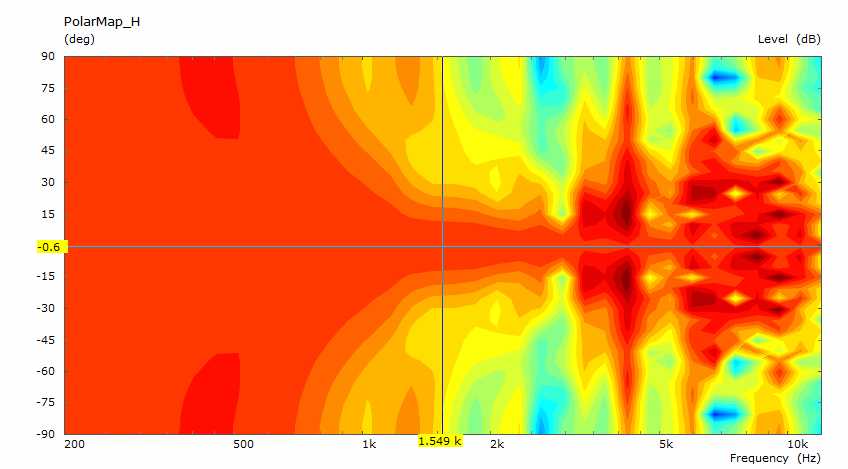
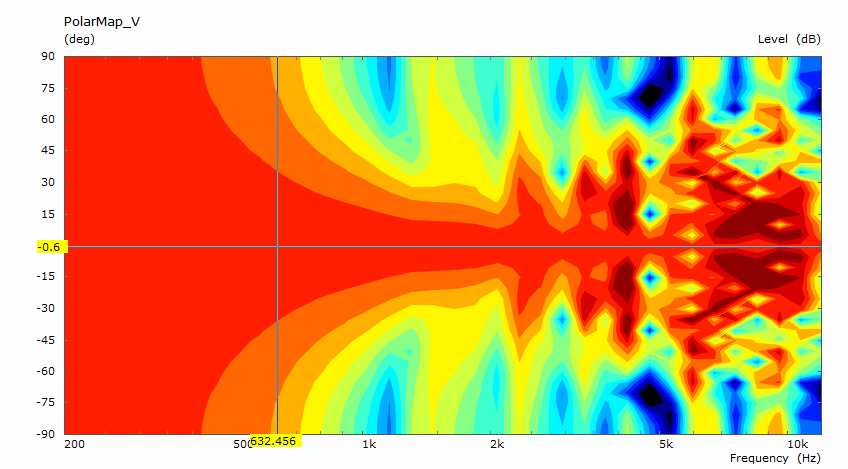
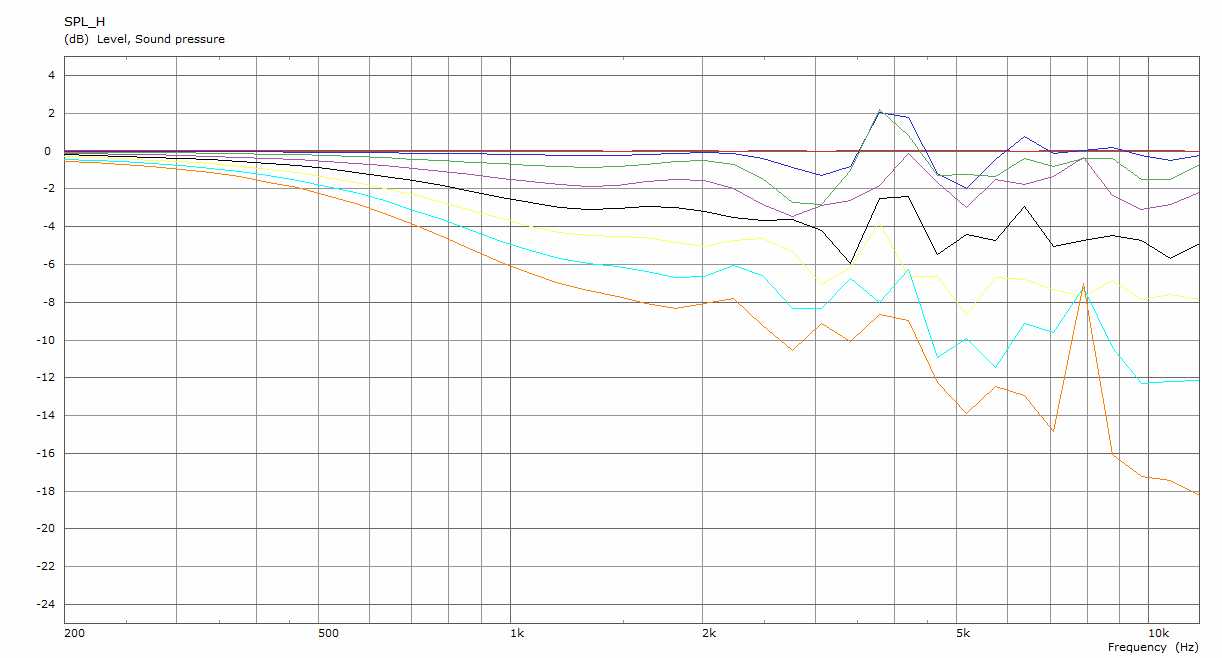
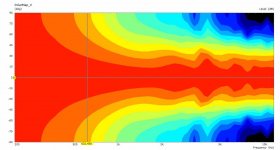
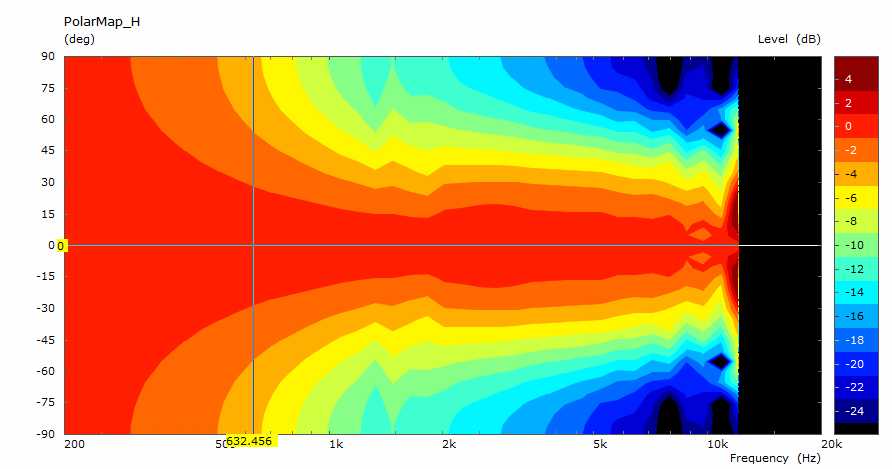
Results for Mesh frequency =4000 are in; 1 hour of simulation vs 1/2 hour

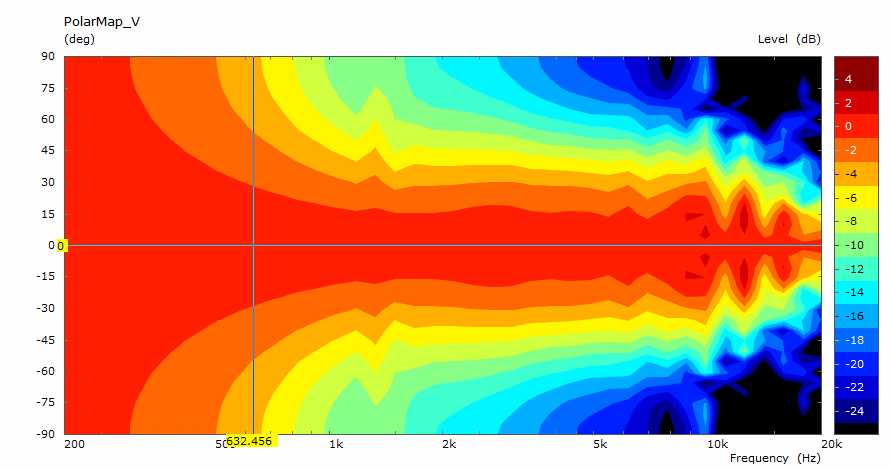
H and V are pretty much the same, as they should be but never were before!
Looks like I need more mesh resolution for that top octave...
H and V are pretty much the same, as they should be but never were before!
Looks like I need more mesh resolution for that top octave...
Attachments
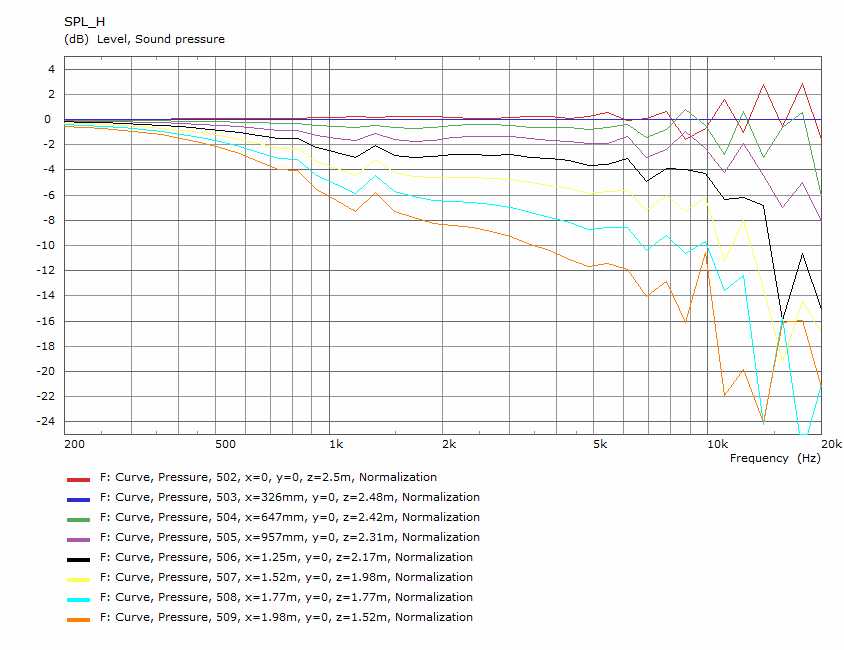
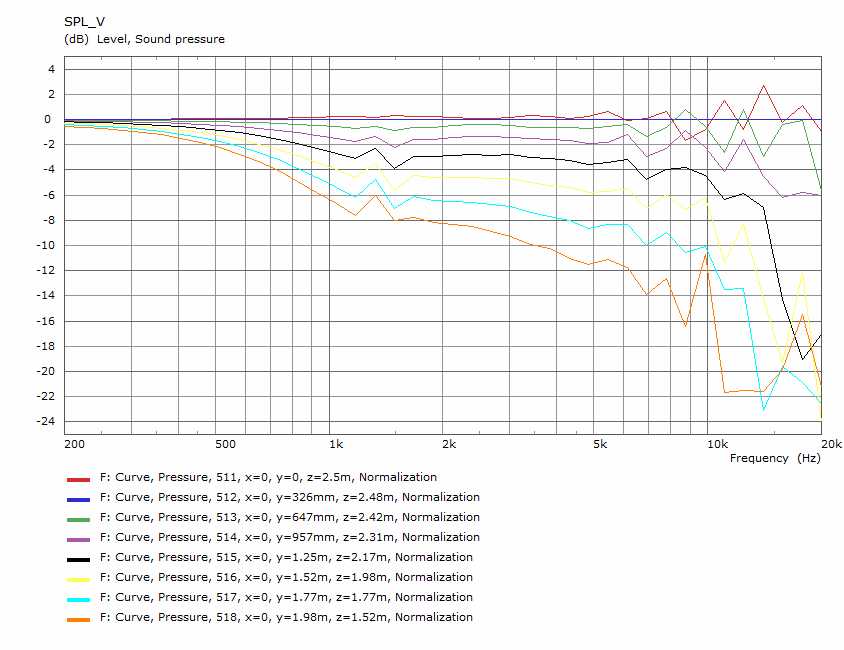
Those results are much better and more consistent with each other. It is not worth trying to simulate above 10 to 12KHz with a full 3D BEM mesh. The edge length requirements become impractical. A finer mesh might help with between 5K and 10K or it could still be an alignment inconsistency, anything other than a smooth surface is difficult to get good results here. The interface could also be playing a role.
What I would try is to simulate between 200 and 10K but use a higher number of frequencies. Make the frequencies a multiple of the number of threads your computer can use. I usually use 48 but sometimes check at 96 to see if it gives a clearer picture.
What I would try is to simulate between 200 and 10K but use a higher number of frequencies. Make the frequencies a multiple of the number of threads your computer can use. I usually use 48 but sometimes check at 96 to see if it gives a clearer picture.
Last edited:
- Home
- Loudspeakers
- Full Range
- Full range line array for wall or corner placement