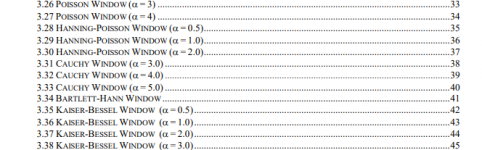
You guy are talking about two different things, all window functions have side lobes that can limit resolution (you can't get something for nothing). This is the best survey of windowing I have found (picture is from this reference). BTW Jan is talking about a method to lock the signal to exact bins needing no windowing, just another technique.
Spectrum and spectral density estimation by the Discrete Fourier
transform (DFT), including a comprehensive list of window
functions and some new flat-top windows.
G. Heinzel∗
, A. Rudiger ¨ and R. Schilling,
Max-Planck-Institut fur ¨ Gravitationsphysik
(Albert-Einstein-Institut)
Teilinstitut Hannover
February 15, 2002
This is also a very good resource:
https://linearaudio.nl/sites/linear...ound Card Instrument Manual & FFT windows.pdf
Characterization of 60 different windows, their transfer functions + example apps.
Jan
Last edited:
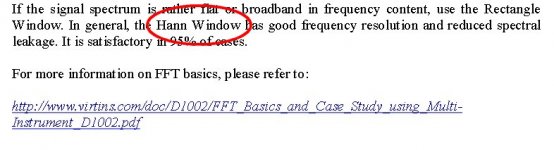
Huh? Those Germans call it a Hanning window? Grrrr. A good reason to not read that stuff. 🙂
More seriously, no window at all (i.e. a rectangular window) gives also rise to leakage (depending on the continuity of the input). Applying windows is just a matter of distributing the leakage in another way over the spectrum. Some windows increase the resolution, while other windows increase the accuracy (of the magnitudes).
The Virtins list talks about a Hamming window, a Bartlett-Hann window and a Hanning window. Different windows.
Jan
I have no problem with wiki explanation
Julius von Hann - Wikipedia
Here, the use of the Hann window is called "hanning", e.g., "hanning" a signal is to apply the Hann window to it.
Julius von Hann - Wikipedia
#offtopic
I do have problems calling it a Hanning window. According this 'logic' one also should talk about a Hamminging, Kaisering, or Barletting window. Rubbish of course.
His name is von Hann period. Only an illiterate idiot would call it a Hanning window.
NB: Also Richard W. Hamming calls it a Hann window (in "The Art of Doing Science and Engineering") and he knows what he is talking about.
Cheers,
E.
edit: No! See page 4 of your link in post 1041. 🙂The Virtins list talks about a Hamming window, a Bartlett-Hann window and a Hanning window. Different windows.
Jan
I have no problem with wiki explanation
Julius von Hann - Wikipedia
I do have problems calling it a Hanning window. According this 'logic' one also should talk about a Hamminging, Kaisering, or Barletting window. Rubbish of course.
His name is von Hann period.
Only an illiterate idiot would call it a Hanning window.NB: Also Richard W. Hamming calls it a Hann window (in "The Art of Doing Science and Engineering") and he knows what he is talking about.
Cheers,
E.
Last edited:
edit: No! See page 4 of your link in post 1041. 🙂
Cheers,
E.
That's just a type of an illiterate idiot. Only one. ;-)
Jan
Attachments
Notch filter compensation
Back to business.
Cheers,
E.
Back to business.
See comment below.When I switch from normal to notch compensation it does change the amplitude relationships. The pictures are with the compensation on.
Yes.I believe the process for characterizing the notch is to select it in options then run a distortion test.
Sure.I saved the compensation file and included it. When I measure the notch I get around 69.5 dB loss at 994 Hz and 10 dB at 1998 Hz and 6.95 dB at 2982 Hz. I think this matches the file reasonably well.
You mean the discrepancy between THD and coherent plot, don't you? Well, the answer simple (and embarrassing): In the current version, the notch compensation doesn't work yet on the wide band spectra. Although it was on my to-do list, I simply forget to implement this feature (probably because I considered these wide band spectra of minor importance). Anyhow, I will correct this omission (next week I hope).The remaining question has to do with the two plots and whether anything can be inferred about level from the coherent plot and how to do it.
Cheers,
E.
Curious, since it does do something, just not sure what.
I'll try it next with the Victor oscillator.
I'll try it next with the Victor oscillator.
Notch filter compensation
Sure, it does do something: adapting the residual. But do you mean it also does something with the raw (wide band) spectra? In that case something is wrong, as it should do nothing (currently).
BTW, now I remember why I "forgot" to implement the compensation of the wide band spectra. The difficulty is that the notch characterization file only contains data of the fundamental and its harmonics. So pretty useless for compensation of the these spectra. Although I can solve this by means of interpolation for frequencies above the fundamental, but not below that point. That's the reason I've postponed the compensation for these spectra. A possible solution might be to simulate the response of the notch filter, provided that it is a standard passive one.
Anyhow, for the moment, only the THD spectrum is correctly compensated.
Cheers,
E.
Hi Demian,Curious, since it does do something, just not sure what.
I'll try it next with the Victor oscillator.
Sure, it does do something: adapting the residual. But do you mean it also does something with the raw (wide band) spectra? In that case something is wrong, as it should do nothing (currently).
BTW, now I remember why I "forgot" to implement the compensation of the wide band spectra. The difficulty is that the notch characterization file only contains data of the fundamental and its harmonics. So pretty useless for compensation of the these spectra. Although I can solve this by means of interpolation for frequencies above the fundamental, but not below that point. That's the reason I've postponed the compensation for these spectra. A possible solution might be to simulate the response of the notch filter, provided that it is a standard passive one.
Anyhow, for the moment, only the THD spectrum is correctly compensated.
Cheers,
E.
Having the transfer function of the notch filter in the num/den polynomial format would probably simplify the calculations in DiAna, and the filter definition input would reduce to the polynomial coefficients only
The transfer function can be derived for the filter topology used, and is probably available in the standard texts.
I've got it for my Hall topology filter, and it agrees very well with the measured one.
Just a thought.
Regards,
Braca
The transfer function can be derived for the filter topology used, and is probably available in the standard texts.
I've got it for my Hall topology filter, and it agrees very well with the measured one.
Just a thought.
Regards,
Braca

Hi Braca,
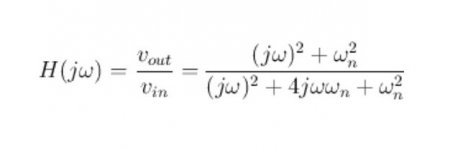
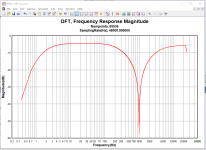
Is it like the X-fer function as shown below? This one applies to a passive twin-T filter that I'm currently using.
Cheers,
E.
Hello Edmond,
Yes, this is the essence of the idea.
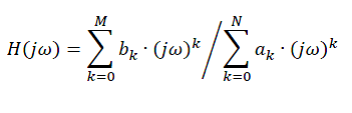
For the data entry, it would probably be easier to use the rational function form attached below.
For a third-order filter, it would be M = N = 3; and the polynomial coefficients would have to be provided by the user.
Using complex arithmetic in your program, it is then easy to calculate the gain and phase at a given frequency.
Regards,
Braca
Attachments
Or a combination - using series of user-supplied amplitudes and phases at several frequencies to estimate the b_k, a_k coeffs with nonlinear regression and using the estimated transfer function at any frequency of the chart.
I have started the tests here:NiZn ferrites or iron powder/polymer might be better, I think I will do some tests, as I will also need ultra-low THD coils in the future (but I am not too optimistic)
https://www.diyaudio.com/forums/parts/354641-linearities-cored-inductors.html#post6208395
I am just wrestling with that for the RTX under REW. The easiest way is to do a freq response run on the filter and use that as the cal file, inverted if needed. Done ;-)
Jan
Jan
Having a set of theoretically determined coefficients also provides for great starting values for a nonlinear regression.Or a combination - using series of user-supplied amplitudes and phases at several frequencies to estimate the b_k, a_k coeffs with nonlinear regression and using the estimated transfer function at any frequency of the chart.
Would it maybe be useful to have 64k points charactersing the notch filter from 0 to Fs/2?
I had ARTA measure my Didden Twin T balanced filter. File attached. Rename extension to TXT or CSV.
Most programs seam to use dB for the magnitude.
Yes.
Jan
Attachments
Yes.
Jan
Jan do you do anything to assure the null is at a bin center, I have found that you can have several dB's of error especially if the null is exactly between bins. There is an argument to deliberately de-Q a notch to lower the artifacts when the center drifts a little with temp/time.
Drift
If the drift is relative small (a few ppm) the impact on the insertion loss and phase of the harmonics is small and has very little impact on the reconstruction of the residual. As for the fundamental, it depends. A passive notch filter at 1kHz with a notch depth of -60dB, a frequency mismatch of 3Hz will result in a decreased damping of about 1 to1.5dB. Does it matter? Only if you do use this figure to reconstruct the fundamental or if you use it to calculate the relative distortion (WRT the fundamental), otherwise who cares. (sorry for the late response)
Cheers,
E.
Hi Jan,Impressive. Edmond, a question. What would be the impact if the signal is fixed in freq and the notch drift? How important is it that the notch depth is constant?
[...]
Jan
If the drift is relative small (a few ppm) the impact on the insertion loss and phase of the harmonics is small and has very little impact on the reconstruction of the residual. As for the fundamental, it depends. A passive notch filter at 1kHz with a notch depth of -60dB, a frequency mismatch of 3Hz will result in a decreased damping of about 1 to1.5dB. Does it matter? Only if you do use this figure to reconstruct the fundamental or if you use it to calculate the relative distortion (WRT the fundamental), otherwise who cares. (sorry for the late response)
Cheers,
E.
- Home
- Design & Build
- Equipment & Tools
- DiAna, a software Distortion Analyzer