Arari were really clunky and expensive. I got the Commodare and its newer models -- 64. 128 until IMB came out..... PC, XT, AT 286/386/486 et al. Upgrades for ever. Modem speed upgrades all the time over the phone lines. and, after using RT-11 IBM was easy to use because the system was a stripped RT-11 with GUI added.
Mem and storage.... cassettes? OMG. a few K of mem was gold. Codes were very efficient. I miss not being able to customize via BIOS and DOS.
not really.
Try WIN 10 PRO. It seems to be a different beast than just WIN 10. WIN 10 is a disaster and I went back to 8. But PRO might be the original code where-as the -10 only is a stripped PRO? PRO version works great on my new-ish computer.
I also noticed over time, that Mcrosoft's new software releases are best for new gen computer and not developed on or for a legacy machine. So a new WIN works very well on newest computers. And a lot of RAM and SS storage is mandatory now.
-RM
Last edited:
Cassette? Punched tape, that was the first medium with program code that I met 🙂. And I guess you as well. And IBM room computer.
Cassette data storage for Commodore.
IBM and Cray and CDC and PDP and RT-11's for control and some data gathering on experiments. Of that era. paper tape, cards, TTY and slow modems.... what a night mare. Basic, Pascal, Fortran, C. etc. I know a really good chemist who quit because of having to learn to program everything for his own experiments.
Glad to have lived long enough to see the level of PC we have now. But will I have any issues with RTX6001? Today, if it isnt PNP, I dont want it.
-RM
Last edited:
FWIW I go back to a Bendix G-15 and paper tape. Even today I still have a problem with numbers on the keyboard since the tape punch I used in the 6th grade was non-standard.
For vintage computing discussions go here: Vintage Computing - Page 1
Lets get back to getting good results from Diana. First for decent results from Win 10 do a fresh install. While you can upgrade, my experience with every version of Windows is that a fresh install works way better. There are some processes when Windows starts that can be demanding. The worst is indexing. a simple check after startup of running processes and cpu use (ctl-alt-delete => task manager => details => processes) to see who the offenders are. There is probably someone who has addressed the issue already. I hope the statistics below are helpful. the distortion numbers are remarkably good.
Second, make sure the USB host controller is not swamped with some other device. ideally an independent controller for the audio subsystem. However that has not proven to be an issue for me with decent hardware.
For what its worth I just tried a test from cold start to a finished measurement (with Diana like those above) with the RTX6001 took 1 minute and 47 seconds on a Win 10 system (AMD FX-4350 + SSD). No errors or dropout.
Attachments

Last edited:
But will I have any issues with RTX6001? Today, if it isnt PNP, I dont want it.
-RM
My experiences with the RTX6001 have been really good. There have been a few minor issues but they have all been addressed. RE plug and play is not true for any analyzer. The more capable/sophisticated the more you need to learn to use it. The AP is not obvious. Getting good results from a Shibasoku requires a bit of learning. The closest to plug and play would be the Krohn Hite generator + analyzer since the analyzer is auto everything with no options.
I would like for Diana to link to the RTX control software to correct the scaling but its not a roadblock to getting good data.
[...]
I would like for Diana to link to the RTX control software to correct the scaling but its not a roadblock to getting good data.
Hi Demian,
If you mean to invoke the RTX ASIO control panel (ACP) from DiAna, I'm working on it. But it's not that easy, as the specifications how to open, read/write settings and closing this panel (that is, form inside another application) is incomplete and poorly defined by Steinberg. As a result, every manufacturer implements this function in a different way (or not at all). So, making an universal and bullet proof procedure to handle the ACP, is almost impossible.
BTW, As suggested in post 376, I've made a special version of DiAna for you (not yet uploaded), that allows loading and saving of "profiles". Are you interested?
Cheers, E.
I am interested and I'll explore the version with preferences. The RTX attenuation control is a separate application. I'm not sure it uses ASIO. I think it talks directly through HID or something like that.
Would it be possible to have the test settings in a panel that stays open? Maybe grayed out when testing but save several clicks when changing frequency or level.
How is the SNR calculated in distortion? I'm getting -114 THD and -71 SNR. On the incoherent spectrum nothing is above -120 dB except the skirt of the oscillator (a Fluke 510A tweaked for ultra low distortion).
Hi Demian,
Cheers, E.
1: derived from the FHT.
2: derived from the input signal minus the pure fundamental.
3: Not 131072/2 but just 131072, as 50% overlap has been applied, which double the effective FHT size.
I will send this version soon to you, I hope tomorrow when I've fixed some troubles with the ASIO control panel button.I am interested and I'll explore the version with preferences.
I'm afraid as well that it's not possible to read out the attenuation (or gain) from inside DiAna, but it must be possible to read out the record size and sampling rate and automatically transfer these two variable to DiAna. The current version has some issues to do just that and I'm working on it to make it full proof.The RTX attenuation control is a separate application. I'm not sure it uses ASIO. I think it talks directly through HID or something like that.
Of course it would be possible, but it appears rather tricky and I'm afraid a lot of work will be involved to keep DiAna stable. So this feature has to wait until I've more time and some other (minor) bugs has been resolved first.Would it be possible to have the test settings in a panel that stays open? Maybe grayed out when testing but save several clicks when changing frequency or level.
The SNR is calculated by subtracting the THD without noise1 from THD plus noise2. As for the "grass" at or below -120dB: The record size was set at 131072, right? That means there are also 131072 FHT bins3, over which the noise is scattered. The noise per bin will be lower by a factor of sqrt(131072)=362 or 51dB. -71-51 = -122dB, so reasonable in accordance with you observation.How is the SNR calculated in distortion? I'm getting -114 THD and -71 SNR. On the incoherent spectrum nothing is above -120 dB except the skirt of the oscillator (a Fluke 510A tweaked for ultra low distortion).
Cheers, E.
1: derived from the FHT.
2: derived from the input signal minus the pure fundamental.
3: Not 131072/2 but just 131072, as 50% overlap has been applied, which double the effective FHT size.
I'm still a little confused by the SNR. If I understand in this case the SNR would be about the same as the THD+N since the distortion components are small.
These are analog measurements of the THD+N with a 100 KHz bandwidth at about -102 dB (or .0008%) and HD2 at about -130 dB. We need to be able to understand significant disdderences and their origins. I believe on the Diana measurement the level was reported at 3.16V or -10 dBFS so some SNR goes away there. However that suggests the noise floor in 100 KHz of the RTX is maybe -81 dB? I don't think that's correct either. In the past these errors surface as measuring the skirt of the fundamental. Its an analog oscillator so it does have a much wider skirt (phase noise) than a crystal controlled digital oscillator.
I tried this with a digital source and got really close agreement between Diana and the Shibasoku.
Attachments

Signal to noise ratio
Hi Demian,
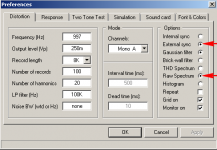
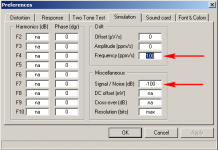
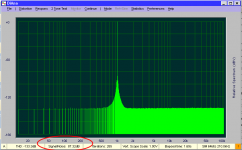
When in simulation mode (done with 64bits precision), noise figures seems to be exact. In this mode, the fundamental is as pure as can be. See pic-1 and pic-2 for setup. Pic-3 shows the noise spectrum without frequency drift and the SNR is 100.02dB, almost exactly equal to the setup value.
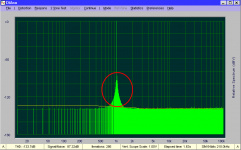
Next, I've mimicked some phase noise by setting the frequency drift to 100pp/s (see pic-2) in order to create a "skirt", see pic-4. Guess what? The SNR dropped to 87.32dB. So a skirt has a large impact on the SNR (QED).
Now the big question is: should we exclude this kind of noise from SNR calculation? What do you think, Demian?
Cheers, E.
PS: The new version of DiAna is still not ready to release, as I've still issues with the ASIO control panel. This time in conjunction with Roland Quad and Octa Capture interfaces.
Hi Demian,
Me too.I'm still a little confused by the SNR.
Agreed.If I understand in this case the SNR would be about the same as the THD+N since the distortion components are small.
I also get higher noise levels with a Lynx L22 compared to the specs.These are analog measurements of the THD+N with a 100 KHz bandwidth at about -102 dB (or .0008%) and HD2 at about -130 dB. We need to be able to understand significant disdderences and their origins. I believe on the Diana measurement the level was reported at 3.16V or -10 dBFS so some SNR goes away there. However that suggests the noise floor in 100 KHz of the RTX is maybe -81 dB? I don't think that's correct either.
Perhaps it is indeed the skirt that is responsible for the excess of noise. To figure this out, I could suppress the skirt by means of a notch filter tuned at the fundamental.In the past these errors surface as measuring the skirt of the fundamental. Its an analog oscillator so it does have a much wider skirt (phase noise) than a crystal controlled digital oscillator.
BTW, also some simulations support the "skirt theory":I tried this with a digital source and got really close agreement between Diana and the Shibasoku.
When in simulation mode (done with 64bits precision), noise figures seems to be exact. In this mode, the fundamental is as pure as can be. See pic-1 and pic-2 for setup. Pic-3 shows the noise spectrum without frequency drift and the SNR is 100.02dB, almost exactly equal to the setup value.
Next, I've mimicked some phase noise by setting the frequency drift to 100pp/s (see pic-2) in order to create a "skirt", see pic-4. Guess what? The SNR dropped to 87.32dB. So a skirt has a large impact on the SNR (QED).
Now the big question is: should we exclude this kind of noise from SNR calculation? What do you think, Demian?
Cheers, E.
PS: The new version of DiAna is still not ready to release, as I've still issues with the ASIO control panel. This time in conjunction with Roland Quad and Octa Capture interfaces.
Attachments
And a bad spot on DiAna (as long as the sample rate is a whole multiple of the signal frequency). 😉2.4kHz is a sweet spot on that 725D.
Cheers, E.
Skirt power
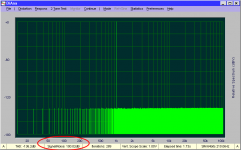
Since a moving average of the noise is already available (see yellow curve), it is probably much easier to determine the excess of noise by calculating the power of "grass" around the fundamental and above the average noise (see red circle). If I subtract this "skirt power" from the total noise power, I hope to get SNR values more in line with the real SNR (that is, without phase noise from the fundamental).
@Demian: Thank you for pointing out that something is wrong (or at least confusing) with the current calculation of the SNR.
Cheers, E.
[...]
Perhaps it is indeed the skirt that is responsible for the excess of noise. To figure this out, I could suppress the skirt by means of a notch filter tuned at the fundamental.
[...]
Since a moving average of the noise is already available (see yellow curve), it is probably much easier to determine the excess of noise by calculating the power of "grass" around the fundamental and above the average noise (see red circle). If I subtract this "skirt power" from the total noise power, I hope to get SNR values more in line with the real SNR (that is, without phase noise from the fundamental).
@Demian: Thank you for pointing out that something is wrong (or at least confusing) with the current calculation of the SNR.
Cheers, E.
Attachments
This comes from the intersection of the analog world and the digital world. in the ideal digital world and oscillator exists at one frequency only with no energy beyond. In this hybrid world you have phase noise which is an analog of the Q of the oscillator, you have windowing effects which resemble the filter skirts of bandpass filters, both of which take a perfect sine and spread its base. If the source and measurement are not synchronous these may be inevitable.
If you could separate the skirt area that would be pretty neat. I wonder how that would work with an isolated digital source with its non-synchronized signal. The quick measurement I made was 10 128K samples.
Can you help explain the meaningful difference in number of samples and size of samples on the final information shown? I would like to know which to use for which measurement and why. Right now I'm guessing.
One other question- where do I change the vertical scale on the waveform display? Can it be linked to FS instead of absolute values?
And a bad spot on DiAna (as long as the sample rate is a whole multiple of the signal frequency). 😉
Cheers, E.
Lol.
2.39kHz is also a sweet spot on that analyzer.
That analyzer was in my possession for a few years.
Phase noise and side lobes
Hi Demian,
As for the so called Raw Spectrum, the FHT size (pair of bins) is equal to the record length (in your case 128k). This applies to coherent averaging as well as incoherent averaging. In these two cases, the spectrum starts at a frequency of sampling rate / record length (instead of the fundamental).
But in all cases, the fundamental is subtracted form the incoming signal before doing an FHT. During processing of each record, the frequency, amplitude, phase and offset of the fundamental are (out of necessity) held constant, of course. In case of no phase noise, this works fine. But if some phase noise is present, there are only 10 opportunities (in this particular case) to adjust the parameters of fundamental, resulting in side lobes (skirt).
Keeping the total numbers of samples equal, but processing 20 records of 64k instead, there are 20 opportunities to adjust the fundamental. As a result, the side lobes will be smaller (have a try).
BTW, making the record length too small will cause convergence errors*.
As for the residual (i.e. yellow curve), the scale can be altered in steps(1,2,5,10 etc), by first moving the cursor somewhere into the upper pane and then using the up or down cursor keys.
In addition, if you whish to read out some values of these curves, just press the left mouse button on it and a "cross hair" will appear with the momentary amplitudes above it. Double click to remove the "cross hair". I hope this will be sufficient to fulfill your needs.
Cheers, E.
*: Why there appear to be convergence errors anyhow? Simply: The calculation of frequency, amplitude, phase and offset is rather complex. Moreover these parameters (computation wise) depends on each other. So, solving that bunch of equations can only be done by means of an iterative process, which will fail sometimes if a certain level of accuracy cannot be reached within a limited number of iterations. This will reported as a convergence error (and the record concerned will be skipped).
Hi Demian,
Sure. Apparently, that's what going on here.This comes from the intersection of the analog world and the digital world. in the ideal digital world and oscillator exists at one frequency only with no energy beyond. In this hybrid world you have phase noise which is an analog of the Q of the oscillator, you have windowing effects which resemble the filter skirts of bandpass filters, both of which take a perfect sine and spread its base. If the source and measurement are not synchronous these may be inevitable.
It depends on the kind of spectrum you are looking at. As for the so called THD spectrum, the FHT size is fixed: 1024, i.e. 512 pairs of bins. The first pair of bins contains the DC level (of course), the second pair contains the fundamental, leaving 510 pairs for the harmonics (not all of them -beyond the Nyquist frequency- are meaningful).If you could separate the skirt area that would be pretty neat. I wonder how that would work with an isolated digital source with its non-synchronized signal. The quick measurement I made was 10 128K samples.
Can you help explain the meaningful difference in number of samples and size of samples on the final information shown? I would like to know which to use for which measurement and why. Right now I'm guessing.
As for the so called Raw Spectrum, the FHT size (pair of bins) is equal to the record length (in your case 128k). This applies to coherent averaging as well as incoherent averaging. In these two cases, the spectrum starts at a frequency of sampling rate / record length (instead of the fundamental).
But in all cases, the fundamental is subtracted form the incoming signal before doing an FHT. During processing of each record, the frequency, amplitude, phase and offset of the fundamental are (out of necessity) held constant, of course. In case of no phase noise, this works fine. But if some phase noise is present, there are only 10 opportunities (in this particular case) to adjust the parameters of fundamental, resulting in side lobes (skirt).
Keeping the total numbers of samples equal, but processing 20 records of 64k instead, there are 20 opportunities to adjust the fundamental. As a result, the side lobes will be smaller (have a try).
BTW, making the record length too small will cause convergence errors*.
The scale of the incoming signal (i.e. the green curve) is fixed, unless you change the cal factors.One other question- where do I change the vertical scale on the waveform display? Can it be linked to FS instead of absolute values?
As for the residual (i.e. yellow curve), the scale can be altered in steps(1,2,5,10 etc), by first moving the cursor somewhere into the upper pane and then using the up or down cursor keys.
In addition, if you whish to read out some values of these curves, just press the left mouse button on it and a "cross hair" will appear with the momentary amplitudes above it. Double click to remove the "cross hair". I hope this will be sufficient to fulfill your needs.
Cheers, E.
*: Why there appear to be convergence errors anyhow? Simply: The calculation of frequency, amplitude, phase and offset is rather complex. Moreover these parameters (computation wise) depends on each other. So, solving that bunch of equations can only be done by means of an iterative process, which will fail sometimes if a certain level of accuracy cannot be reached within a limited number of iterations. This will reported as a convergence error (and the record concerned will be skipped).
Last edited:
I did change them for proper measurement of a signal. With a 10V input it measures correctly but the waveform is completely off the fixed 1V scale.The scale of the incoming signal (i.e. the green curve) is fixed, unless you change the cal factors.
This is really weird and should never happen. Right now, the only thing I can think of is a corrupted ini file. You might delete it and start all over again.I did change them for proper measurement of a signal. With a 10V input it measures correctly but the waveform is completely off the fixed 1V scale.
As for the "fixed 1V scale", is it always 1V, regardless the input level?
It should be adjusted automatically in steps (1, 2, 5 etc), in the same way as for the residual.
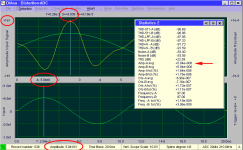
>"With a 10V input it measures correctly" According to what? There are four ways to read out the amplitude, see pic. Are all of them correct? (the two values in the lower pane were obtained during data acquisition, the other two after analysis. I/O levels were 0.5FS and ADC cal fac set to 10)
Cheers, E.
Attachments
PS: In post 416 I wrote: "The scale of the incoming signal (i.e. the green curve) is fixed"
That's not correct. It is automatically adjusted. Contrarily to the scale of the residual, it's only fixed the sense that you can't adjust it manually.
That's not correct. It is automatically adjusted. Contrarily to the scale of the residual, it's only fixed the sense that you can't adjust it manually.
Back at the testing-deleted ini file. Then discovered that the numbers in statistics are peak. Went and converted and recalibrated for peak instead of RMS. Still the lower display is locked at 1V so big signals are off scale and small ones too small to see.
It would be great to have sine conversion and dBFS displayed at the setting menu for the level and some help for the calibration process. Currently I'm trial and error to get the cal factors correct. I'm now within 1% so I won't sweat it.
Let me know when the preferences version is ready to try.
It would be great to have sine conversion and dBFS displayed at the setting menu for the level and some help for the calibration process. Currently I'm trial and error to get the cal factors correct. I'm now within 1% so I won't sweat it.
Let me know when the preferences version is ready to try.
- Home
- Design & Build
- Equipment & Tools
- DiAna, a software Distortion Analyzer