Some peaks, yes.
I asked something similar in #1106 and William Cowan replied in #1110. In short, some of the peaks will likely be bigger than shown and some much smaller (but probably broader) than indicated, due to the loss and precise expansion profile being different from that in the model.
Since then I've built a TH (not so very different from the design posted just above) and there are certainly some of those features present. I found a 4th order low pass was barely adequate (it would have been with additional notches) and a 6th order at 50Hz works well.
I still plan to do some measurements at some point, when time allows for doing it properly.
Ken
Naudio said:do the peeks and dips in the simulations in horn resp above 60hz actually exist?
I asked something similar in #1106 and William Cowan replied in #1110. In short, some of the peaks will likely be bigger than shown and some much smaller (but probably broader) than indicated, due to the loss and precise expansion profile being different from that in the model.
Since then I've built a TH (not so very different from the design posted just above) and there are certainly some of those features present. I found a 4th order low pass was barely adequate (it would have been with additional notches) and a 6th order at 50Hz works well.
I still plan to do some measurements at some point, when time allows for doing it properly.
Ken
In my th the peaks get flat very soon with rising frequency.
see my post with simulation and measured response http://www.diyaudio.com/forums/showthread.php?postid=1457411#post1457411
see my post with simulation and measured response http://www.diyaudio.com/forums/showthread.php?postid=1457411#post1457411
SPL for MTX sub
Hello Chris8sirhC:
Sorry for the long delay--been busy and whatnot. Anyway, assuming that the driver is a 4 ohm unit then 2.83 volts in the simulation will be somewhat less than 1W/1M which is supposed to be equivalent to 2.83 volts for 8 ohm drivers. Perhaps someone more knowledgeable on this forum will give a more accurate answer.
Chris8sirhC said:Killjoy, is that a max spl graph or just the normal 1w/1m graph that has the response around 105-107db?
Hello Chris8sirhC:
Sorry for the long delay--been busy and whatnot. Anyway, assuming that the driver is a 4 ohm unit then 2.83 volts in the simulation will be somewhat less than 1W/1M which is supposed to be equivalent to 2.83 volts for 8 ohm drivers. Perhaps someone more knowledgeable on this forum will give a more accurate answer.
Extreme Slope X-overs
hello MaVo:
Have you given any consideration to http://www.alkeng.com/ extreme slope x-overs? If you go to the website and look under Klipsch horn section you will see a button for x-treme slope x-overs. It is a 120db slope x-over. It shows you how to build it. They can be purchased for $500+ or the get the kit for $300 or less. Or you can download the layout and make your own.
MaVo said:Hi Naudio,
The lowpass filter at 60hz is probably 12db, 16db filters dont exist normally. If it is the only filtering you do, then i think you will hear alot of distortions. 12db at 60 hz means that the output is -12db at 120hz. and -24 at 240 and so on, 12db every octave. In another thread someone posted this: http://en.wikipedia.org/wiki/Equal-loudness_contours
As you can see, at normal listening levels, the perceived loudness of 120hz signal is about 10-20db louder than a 60hz signal. This means, that with a 12db filter at 60hz, 120hz will be perceived about as loud as 60hz. Your sub will have a perceived linear response up to a few hundred hz, still not taking into account the rising response as seen in hornresp above 100hz.
I use at least 24db for my crossovers. You could use a workaround and dial in the crossover lower than you would normally do, lets say between 30 and 60hz, the exact number has to be figured out with listening.
But since those horns have really low distortion, maybe it still sounds very nice 🙂
The filter at 12hz is a highpass filter, which means that high frequencies are passed through it and low frequencies are blocked. To figure out if it is optimal, look at the hornresp excursion graph of 12hz and see if it is about the same level of higher frequency excursions. Of course, a 12hz filter is alot better than no filter at all!
I allways use the one way xmax as found in the drivers spec sheets.
Edit: just looked at the plate sub amp. Maybe a Behringer Amp like the A500 with a active 2 way crossover will be cheaper and more usefull, as they have more options, steeper filters and also filter the low frequencies from your main speakers, which is a great benefit.
The filter is in your plate amp is 18db, which is better than the 12 i guessed, so my above ramblings my be not so important, but still valid to a degree.
hello MaVo:
Have you given any consideration to http://www.alkeng.com/ extreme slope x-overs? If you go to the website and look under Klipsch horn section you will see a button for x-treme slope x-overs. It is a 120db slope x-over. It shows you how to build it. They can be purchased for $500+ or the get the kit for $300 or less. Or you can download the layout and make your own.
I built it, but I still don't understand it! Why does the cone move so little?
From Danley's European Patent application: "Measurements have indicated that the loading on radiators incorporated in a tapped horn according to principles of the present invention have an output raised by about 12dB or a factor of 16, compared to the same drivers in direct radiation. Also, acoustic loads presented in sound reproduction systems according to principles of the present invention typically reduce the radiator motion by about a factor of 4, which then raises the maximum excursion limited output about 12 dB compared to the same drivers radiating directly."
Earlier, from Danley's White Paper: "The diaphragm excursion of the driver is greatly reduced due to the acoustical loading of the horn."
This fits with my own "Scientific Analysis" using a laser pointer, a business card, a multi-meter and an audio editor. In short, I found the cone deflection was about half what HornResp predicted. Unfortunately, that is the limit of my instrumentation system's precision.
Take a look at the patent http://tinyurl.com/2xkxav . Click on the top one. Six pages of tiny type and 10 figures will keep you busy for at least one hour.
Now, where's those eyedrops?
??? Why read tiny type when you can save the whole patent in a .pdf and blow it up full screen if you want?
GM
GM
Killjoy, i use my pc as a crossover, so i dont need such devices. But a 24db crossover together with a nice th should be all you need. Also, i wouldnt spend my money on such esoteric devices, as there is no way to be sure how well it is made without spending lots of money. I use well established hardware from pro audio manufacturers.
What sort of ways are people folding these?Im prefering a ~ 100cm x 100cm x 40cm unit so that it is car transportable/usable.
I actually end up with a little too much path(~3.5m),and less sensitivity.Hmm.
I actually end up with a little too much path(~3.5m),and less sensitivity.Hmm.
An externally hosted image should be here but it was not working when we last tested it.
Don Snyder said:I built it, but I still don't understand it! Why does the cone move so little?
From Danley's European Patent application: "Measurements have indicated that the loading on radiators incorporated in a tapped horn according to principles of the present invention have an output raised by about 12dB or a factor of 16, compared to the same drivers in direct radiation. Also, acoustic loads presented in sound reproduction systems according to principles of the present invention typically reduce the radiator motion by about a factor of 4, which then raises the maximum excursion limited output about 12 dB compared to the same drivers radiating directly."
Earlier, from Danley's White Paper: "The diaphragm excursion of the driver is greatly reduced due to the acoustical loading of the horn."
This fits with my own "Scientific Analysis" using a laser pointer, a business card, a multi-meter and an audio editor. In short, I found the cone deflection was about half what HornResp predicted. Unfortunately, that is the limit of my instrumentation system's precision.
Take a look at the patent http://tinyurl.com/2xkxav . Click on the top one. Six pages of tiny type and 10 figures will keep you busy for at least one hour.
Now, where's those eyedrops?
Exactly how and why the actual cone excursion in a tapped horn is a bit more than half of Hornresp/Akabak predictions -- which do take into account the "increased acoustic loading" -- is a question that nobody seems to be able to answer -- even Tom's postings basically say "because it is"...
I suspect this is also linked to the fact that Tom's measurements show that a real tapped horn (like the TH-115) not only has lower excursion than simulated but is also 2-3dB more efficient -- both of which explain why (but not how!) a real-life tapped horn can beat an optimised reflex (with more/different drivers) even thought the simulations say they perform the same.
Since both simulations programs build a model of the physical parameters of the driver and the horn, sound wave propagation and radiation impedance based on well-known physical laws, it's difficult to see where this discrepancy could arise.
The electrical-mechanical-acoustic analysis of a driver is so well-known that it's unlikely to be wrong, and there's nothing magic about the *physics* of a tapped horn since it's basically a tapered pipe with holes in it -- which it should be perfectly possible to model with reasonable accuracy.
So what's going on? All the enclosures which can be modelled by Hornresp and Akabak (sealed box, reflex, bandpass, horn, tapped horn) consist of a driver in a box which radiates sound, and it's generally accepted that the predictions of efficiency and excursion are reasonably accurate for *all* the enclosure types (including reflex and horn) *except* for the tapped horn.
The same equations and laws of physics apply to all enclosure types, so why is the tapped horn the odd one out?
Cheers
Ian
thanks for all the help so far
due to size restrictions (hight of my room) i have decided i will have to go back to the lab12 horn i was looking at in the first place
here is my technical (slightly crude) diagram, as i only have paint
the horn uses the eminence lab12 driver
http://www.eminence.com/proaudio_sp...etail_link=LAB12&speaker_size=12&SUB_CAT_ID=1
i have one final and big favor to ask, as i don't seem to be able to convert the technical s1 s2 or whatever i see in horn response to a atual design on paper/paint.......
could someone please run a quick simulation for this exact horn, and post me the graphs, im kinda stuck on this otherwise
in fact even the input perimeters would be great! that way i could run a simulation for different drivers (and i wouldn't feel so lazy)
thanks 🙄
somehow i feel like im designing this backwards lol
due to size restrictions (hight of my room) i have decided i will have to go back to the lab12 horn i was looking at in the first place
here is my technical (slightly crude) diagram, as i only have paint
the horn uses the eminence lab12 driver
http://www.eminence.com/proaudio_sp...etail_link=LAB12&speaker_size=12&SUB_CAT_ID=1
i have one final and big favor to ask, as i don't seem to be able to convert the technical s1 s2 or whatever i see in horn response to a atual design on paper/paint.......
could someone please run a quick simulation for this exact horn, and post me the graphs, im kinda stuck on this otherwise
An externally hosted image should be here but it was not working when we last tested it.
in fact even the input perimeters would be great! that way i could run a simulation for different drivers (and i wouldn't feel so lazy)
thanks 🙄
somehow i feel like im designing this backwards lol
would make sense, but how do u convert whats entered in horn resp to an atual design?
and what do i need to change on the design to get it flatter to 20hz
the length is 2204 internal dunno about that middle section
if i could be pointed to a part of this forum where someone explains what s1 s2 etc etc is and how to convert that from a plan to a simulation, and visa versa, then that would be great, because i kinda since im just being irritating now, im sure its simple enough when u know how
LAB12_TH_General
Hi Naudio,
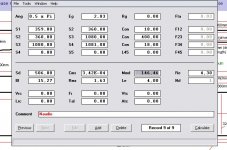
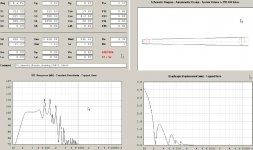
I agree with MaVo (Post #1473) that you may want to start with a hornresp model, and there is just a world of help in this thread as to that subject. David McBean has done a great job with his program and especially the newest version of the Tapped Horn Wizard.
Also, the driver parameters are key to the enclosure simulations, so make certain that you get the correct data.
I'll try to attach a drawing of your proposed enclosure with the areas and length indicated, maybe that will help you to convert from a hornresp model to an enclosure drawing (as you said: "its simple enough when u know how").
As to the two main peaks just above the lower passband: the concensus seems to be that they can be tamed with 1/4 wave resonators. The method, simulations and pictures are earlier in the thread (don't remember when, you may just have to go through it unless somebody took notes).
I'll also enclose another (similar to MaVo's) hornresp simulation derived from your drawing with the addition of a series inductor (the inductor's resistive component is added to Rg and the inductance to Le), again this has been explained in some detail previously.
Hi Naudio,
I agree with MaVo (Post #1473) that you may want to start with a hornresp model, and there is just a world of help in this thread as to that subject. David McBean has done a great job with his program and especially the newest version of the Tapped Horn Wizard.
Also, the driver parameters are key to the enclosure simulations, so make certain that you get the correct data.
I'll try to attach a drawing of your proposed enclosure with the areas and length indicated, maybe that will help you to convert from a hornresp model to an enclosure drawing (as you said: "its simple enough when u know how").
As to the two main peaks just above the lower passband: the concensus seems to be that they can be tamed with 1/4 wave resonators. The method, simulations and pictures are earlier in the thread (don't remember when, you may just have to go through it unless somebody took notes).
I'll also enclose another (similar to MaVo's) hornresp simulation derived from your drawing with the addition of a series inductor (the inductor's resistive component is added to Rg and the inductance to Le), again this has been explained in some detail previously.
Attachments
Request for more info about your measurement
It would be great if you could tell us at which frequencies (or over which frequency range) you did this test.
I think that must give a big clue to understanding the hypothesis that hornresp (etc.) gives the wrong answer.
The TH output contains various mixtures of rear and front radiation at different frequencies, and the driver sees a load that varies a lot with frequency too. At some frequency the situation must be very close to one which is already known to be correctly modelled (e.g. a bass reflex, or even a sealed box).
So I'd say that, if there are differences in the modelled and measured excursion, there should also be differences between the equivalent frequency responses.
Is that so?
Ken
Don Snyder said:I built it, but I still don't understand it! Why does the
This fits with my own "Scientific Analysis" using a laser pointer, a business card, a multi-meter and an audio editor. In short, I found the cone deflection was about half what HornResp predicted. Unfortunately, that is the limit of my instrumentation system's precision.
It would be great if you could tell us at which frequencies (or over which frequency range) you did this test.
I think that must give a big clue to understanding the hypothesis that hornresp (etc.) gives the wrong answer.
The TH output contains various mixtures of rear and front radiation at different frequencies, and the driver sees a load that varies a lot with frequency too. At some frequency the situation must be very close to one which is already known to be correctly modelled (e.g. a bass reflex, or even a sealed box).
So I'd say that, if there are differences in the modelled and measured excursion, there should also be differences between the equivalent frequency responses.
Is that so?
Ken
Here's my tapped horn:
It needs a higher compression (it's only 1.48:1 at the moment). I have blown one of these woofers in testing (from overpowering). I does go deep for a 6.5", but not as loud as I'm used to.
It needs a higher compression (it's only 1.48:1 at the moment). I have blown one of these woofers in testing (from overpowering). I does go deep for a 6.5", but not as loud as I'm used to.
An externally hosted image should be here but it was not working when we last tested it.
Re: Request for more info about your measurement
You're right about the varying load and mix of front/rear radiation with increasing frequency -- this is how the tapped horn works, and is precisely what is modelled with Hornresp and Akabak.
There's no inherent reason why the simulations should be wrong because of this, the analysis methods used (which just solve well-known electroacoustic equations) should be perfectly capable of analysing much more complex systems than a tapped horn.
From what's been reported (by Tom, William and others) there doesn't seem to be a significant discrepancy in simulated vs. measured frequency response (flatness/rolloff), the discrepancy (if there is one) is in excursion (lower) and efficiency (higher).
The hypothesis is that this is because in real life the loading on the cone is somehow better than in simulation, which would both reduce excursion and increase efficiency as reported.
What is missing right now is any explanation as to why this could be the case, and where the simulations are in error -- if they are...
The reason that this matters is that maximum SPL is *very* strongly affected by such an error; for example, if Tom's figures for the TH-115 are correct the excursion-limited power handling is about 2.5x that predicted by Hornresp/Akabak (4dB SPL increase) and the efficiency is 2-6dB higher (depending on frequency).
This means the actual maximum SPL is 6-10dB higher than simulated, which is an *enormous* difference when it comes to deciding whether a tapped horn is up to a particular job or not...
Ian
kstrain said:
It would be great if you could tell us at which frequencies (or over which frequency range) you did this test.
I think that must give a big clue to understanding the hypothesis that hornresp (etc.) gives the wrong answer.
The TH output contains various mixtures of rear and front radiation at different frequencies, and the driver sees a load that varies a lot with frequency too. At some frequency the situation must be very close to one which is already known to be correctly modelled (e.g. a bass reflex, or even a sealed box).
So I'd say that, if there are differences in the modelled and measured excursion, there should also be differences between the equivalent frequency responses.
Is that so?
Ken
You're right about the varying load and mix of front/rear radiation with increasing frequency -- this is how the tapped horn works, and is precisely what is modelled with Hornresp and Akabak.
There's no inherent reason why the simulations should be wrong because of this, the analysis methods used (which just solve well-known electroacoustic equations) should be perfectly capable of analysing much more complex systems than a tapped horn.
From what's been reported (by Tom, William and others) there doesn't seem to be a significant discrepancy in simulated vs. measured frequency response (flatness/rolloff), the discrepancy (if there is one) is in excursion (lower) and efficiency (higher).
The hypothesis is that this is because in real life the loading on the cone is somehow better than in simulation, which would both reduce excursion and increase efficiency as reported.
What is missing right now is any explanation as to why this could be the case, and where the simulations are in error -- if they are...
The reason that this matters is that maximum SPL is *very* strongly affected by such an error; for example, if Tom's figures for the TH-115 are correct the excursion-limited power handling is about 2.5x that predicted by Hornresp/Akabak (4dB SPL increase) and the efficiency is 2-6dB higher (depending on frequency).
This means the actual maximum SPL is 6-10dB higher than simulated, which is an *enormous* difference when it comes to deciding whether a tapped horn is up to a particular job or not...
Ian
- Home
- Loudspeakers
- Subwoofers
- Collaborative Tapped horn project