I still don't get it.
It's A over R, R being a constant magnitude and zero phase we are left with A. I still don't get it either, an inductor has a 20dB per decade roll off of magnitude of impedance. So what is the math being done to extract the embedded inductance, what is the assumed model of the motor?
Attachments
I agree, there's a missing step(s). I assume just the imaginary part of the impedance is examined, and from that inductance is derived knowing f?It's A over R, R being a constant magnitude and zero phase we are left with A. I still don't get it either, an inductor has a 20dB per decade roll off of magnitude of impedance. So what is the math being done to extract the embedded inductance, what is the assumed model of the motor?
And the phase curve in j's posts isn't right for a minimum phase LCR system, so can't be measured or what we think it is either.
I don't really see the need to be cryptic here.
LD
First of all we have to know what the algorithm is behind Jackini’s measurement before we can come to any conclusions like mininum phase or not.I agree, there's a missing step(s). I assume just the imaginary part of the impedance is examined, and from that inductance is derived knowing f?
And the phase curve in j's posts isn't right for a minimum phase LCR system, so can't be measured or what we think it is either.
I don't really see the need to be cryptic here.
LD
Does the HP assume a pure inductuance, the math behind that is simple but that does not match the images shown. At Fres impedance is very large and not small as in J’s image, no matter how complex the real thing is.
Hans
.It's A over R, R being a constant magnitude and zero phase we are left with A. I still don't get it either, an inductor has a 20dB per decade roll off of magnitude of impedance. So what is the math being done to extract the embedded inductance, what is the assumed model of the motor?
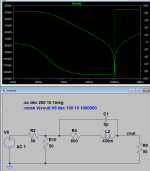
When giving the Cart the impedance Z, the following can be determined:
Vout=Vin*Rload/(Rload+Z) giving Z=Rload*(Vin-Vout)/Vout.
In fact Rload is not just a resistance, but the probe capacity has to be added, as I did in my model.
However the effect of this cap is small on the amplitude and only marginal effect on the phase as can be seen in image 1 when using just 460mH for Z.
R10 in your model plays no role when using the above algorithm since only Vin is used.
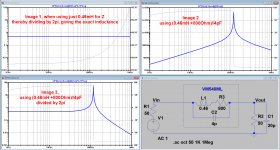
So we can say Z=50*(Vin-Vout)/Vout giving image 2 below.
In this image the peak is pointing upwards.
When playing with a split coil with different ratio's of par caps, I get either two peaks pointing upwards or one peak upwards an one downwards, so there is at least always one peak pointing upwards.
Jackinnj's image has only one peak, so we can exclude split poles with different ratios of caps.
Now diving the graph by 2pi as if the cart where a pure coil gives me image 3.
So roughly up to 30Khz, the image is identical to image 1, from thereon the par Cap is taking its part.
So to conclude, in no way can I reconstruct Jackinnj's image with the peak pointing downwards, so the question remains, what is he algorithm that has being used here.
Hans
Attachments
In fact Rload is not just a resistance, but the probe capacity has to be added, as I did in my model.
There is no probe capacity, it's a network analyzer. With care the ports are a nearly perfect 50 Ohms, in fact many come with a warning about DC at the input.
Last edited:
Yes but at Fres impedance is all real. So if looking at imag part only it would dip.Does the HP assume a pure inductuance, the math behind that is simple but that does not match the images shown. At Fres impedance is very large and not small as in J’s image, no matter how complex the real thing is.
Hans
LD
O.k. thanks, I could exclude the capacity anyhow because it did not seem play any role.There is no probe capacity, it's a network analyzer. With care the ports are a nearly perfect 50 Ohms, in fact many come with a warning about DC at the input.
Hans
As a refresher, computing the Z parameters from the S parameters. I hate HP's HPIB programming but it can do some maths on plots. I would assume if there was any non-minimum phase behavior the answers would be wrong by some margin (maybe small?). Another point, putting a MM cart into a 50 Ohm test jig is asking the instrument to operate at a ~1000:1 impedance mismatch, simulators don't care they always have 300dB of DNR.
https://www.ieee.li/pdf/essay/s_parameters_of_passive_components.pdf
https://www.ieee.li/pdf/essay/s_parameters_of_passive_components.pdf
Last edited:
Sshhhh no one told the instrument about the mismatch. Should be OK at 10kHz and small sigsAnother point, putting a MM cart into a 50 Ohm test jig is asking the instrument to operate at a ~1000:1 impedance mismatch, simulators don't care they always have 300dB of DNR.
LD
Corollary is that |imag part of impedance| can't fairly be assumed to be inductive. For example the slope downward with f is predicted and probably isn't due to falling inductance, just the natural artefact of the phase system in play.Yes but at Fres impedance is all real. So if looking at imag part only it would dip.
LD
Losing confidence rapidly, yoda is.
LD
Last edited:
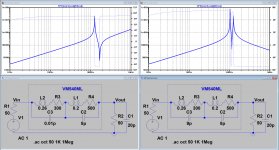
Having magnified the plot around fres, the image below now showing them all: Re, Im and the modulus part.Yes but at Fres impedance is all real. So if looking at imag part only it would dip.
LD
I looked in the above Sim images at the modulus of Z, but in the image below you see all three.
The imaginary does not have a dip but changes from pos to negative.
The image from Jackinnj is still impossible to reproduce.
Hans
Attachments
(Jan, aren't you sorry you sold your HP3577?)
Don't rub it in!
Jan
As a refresher, computing the Z parameters from the S parameters. I hate HP's HPIB programming but it can do some maths on plots. I would assume if there was any non-minimum phase behavior the answers would be wrong by some margin (maybe small?). Another point, putting a MM cart into a 50 Ohm test jig is asking the instrument to operate at a ~1000:1 impedance mismatch, simulators don't care they always have 300dB of DNR.
https://www.ieee.li/pdf/essay/s_parameters_of_passive_components.pdf
Interesting link, thanks.
Hans
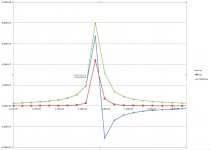
Yes, if you have a few more points around the interesting bit, you'll see the real part increasing rapidly as the phase begins to transition. As imag flips it passes through zero, and if you plot |imag| it has a sharp dip.The imaginary does not have a dip but changes from pos to negative.
The image from Jackinnj is still impossible to reproduce.
what is happening is that impedance not only is getting bigger, it is getting more 'real', the vector angle is nearing zero deg and makes it very sharply.
I agree with you, btw. I think this is why the dip in j's plots but it's not useful.
LD
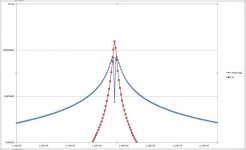
On a much finer grid, 1000 points/oct, I have now plotted the |Imag| and Re around Fres on a log scale.Yes, if you have a few more points around the interesting bit, you'll see the real part increasing rapidly as the phase begins to transition. As imag flips it passes through zero, and if you plot |imag| it has a sharp dip.
what is happening is that impedance not only is getting bigger, it is getting more 'real', the vector angle is nearing zero deg and makes it very sharply.
I agree with you, btw. I think this is why the dip in j's plots but it's not useful.
LD
Does this give new insights, I think so..
Hans
Attachments
On a much finer grid, 1000 points/oct, I have now plotted the |Imag| and Re around Fres on a log scale.
Does this give new insights, I think so..
Hans the Q's on simulations are physically not realizable in a real component (except maybe a quartz crystals) hence you end up chasing mathematical artifacts. BTW the magnitude of the imaginary component alone has no physical meaning.
Last edited:
Hans the Q's on simulations are physically not realizable in a real component (except maybe a quartz crystals) hence you end up chasing mathematical artifacts.
Scott, I know, but that’s not the point.
I only wanted to make clear that whatever you do, impedance around fres goes always upwards when measuring a Cart.
The Q in these sims is way too high, but that doesn’t matter in this case.
Hans
Scott, I know, but that’s not the point.
I only wanted to make clear that whatever you do, impedance around fres goes always upwards when measuring a Cart.
Yes, but on an S parameter box A/R is not impedance it's forward transmission and the parallel resonance gives a sharp dip. A/R = 50/(Z +50), you must be careful to keep all the math as complex algebra till the end and then take the magnitude and phase.
Last edited:
I just checked two older MM cartridges in my junkbox. Measured them with my ESI videobridge. One Shure and one AT. The Shure is around 500 mH and around 500 Ohms at 1 KHz and changes a little from 1V to 10 mV at 1 KHz. The resistance increases at higher frequencies to 20 K and resonance is around 30K. Above the inductance goes negative or reports and a small capacitance. The AT is 400 mH and 1.5K Ohms at 1 KHz. It resonates at around 40 KHz.
- Status
- Not open for further replies.
- Home
- Source & Line
- Analogue Source
- Cartridge dynamic behaviour