... then what it does is to identify the FFT bins where it can find the non-linear products. I asked it to look for IM products up to 3rd order and this was the result:
Using sample rate of 44100 Hz
Fundamentals:
Input freq = 1001.29
Freq = 1001.29395, Bin # = 372, Bin count = 1
Input freq = 1776.49
Freq = 1776.48926, Bin # = 660, Bin count = 1
Input freq = 3160
Freq = 3159.99756, Bin # = 1174, Bin count = 1
Input freq = 5625.55
Freq = 5625.54932, Bin # = 2090, Bin count = 1
Input freq = 10002.2
Freq = 10002.1729, Bin # = 3716, Bin count = 1
IM Products:
Input freqs = 1001.29 + 1776.49
1F1 + 1F2 Freq = 2777.7832, Bin # = 1032, Bin count = 1
1F1 - 1F2 Freq = 775.195313, Bin # = 288, Bin count = 1
1F1 + 2F2 Freq = 4554.27246, Bin # = 1692, Bin count = 1
1F1 - 2F2 Freq = 2551.68457, Bin # = 948, Bin count = 1
2F1 + 1F2 Freq = 3779.07715, Bin # = 1404, Bin count = 1
2F1 - 1F2 Freq = 226.098633, Bin # = 84, Bin count = 1
Input freqs = 1001.29 + 3160
1F1 + 1F2 Freq = 4161.2915, Bin # = 1546, Bin count = 1
1F1 - 1F2 Freq = 2158.70361, Bin # = 802, Bin count = 1
1F1 + 2F2 Freq = 7321.28906, Bin # = 2720, Bin count = 1
1F1 - 2F2 Freq = 5318.70117, Bin # = 1976, Bin count = 1
2F1 + 1F2 Freq = 5162.58545, Bin # = 1918, Bin count = 1
2F1 - 1F2 Freq = 1157.40967, Bin # = 430, Bin count = 1
Input freqs = 1001.29 + 5625.55
1F1 + 1F2 Freq = 6626.84326, Bin # = 2462, Bin count = 1
1F1 - 1F2 Freq = 4624.25537, Bin # = 1718, Bin count = 1
1F1 + 2F2 Freq = 12252.3926, Bin # = 4552, Bin count = 1
1F1 - 2F2 Freq = 10249.8047, Bin # = 3808, Bin count = 1
2F1 + 1F2 Freq = 7628.13721, Bin # = 2834, Bin count = 1
2F1 - 1F2 Freq = 3622.96143, Bin # = 1346, Bin count = 1
Input freqs = 1001.29 + 10002.2
1F1 + 1F2 Freq = 11003.4668, Bin # = 4088, Bin count = 1
1F1 - 1F2 Freq = 9000.87891, Bin # = 3344, Bin count = 1
1F1 + 2F2 Freq = 21005.6396, Bin # = 7804, Bin count = 1
1F1 - 2F2 Freq = 19003.0518, Bin # = 7060, Bin count = 1
2F1 + 1F2 Freq = 12004.7607, Bin # = 4460, Bin count = 1
2F1 - 1F2 Freq = 7999.58496, Bin # = 2972, Bin count = 1
Input freqs = 1776.49 + 3160
1F1 + 1F2 Freq = 4936.48682, Bin # = 1834, Bin count = 1
1F1 - 1F2 Freq = 1383.5083, Bin # = 514, Bin count = 1
1F1 + 2F2 Freq = 8096.48438, Bin # = 3008, Bin count = 1
1F1 - 2F2 Freq = 4543.50586, Bin # = 1688, Bin count = 1
2F1 + 1F2 Freq = 6712.97607, Bin # = 2494, Bin count = 1
2F1 - 1F2 Freq = 392.980957, Bin # = 146, Bin count = 1
Input freqs = 1776.49 + 5625.55
1F1 + 1F2 Freq = 7402.03857, Bin # = 2750, Bin count = 1
1F1 - 1F2 Freq = 3849.06006, Bin # = 1430, Bin count = 1
1F1 + 2F2 Freq = 13027.5879, Bin # = 4840, Bin count = 1
1F1 - 2F2 Freq = 9474.60938, Bin # = 3520, Bin count = 1
2F1 + 1F2 Freq = 9178.52783, Bin # = 3410, Bin count = 1
2F1 - 1F2 Freq = 2072.5708, Bin # = 770, Bin count = 1
Input freqs = 1776.49 + 10002.2
1F1 + 1F2 Freq = 11778.6621, Bin # = 4376, Bin count = 1
1F1 - 1F2 Freq = 8225.68359, Bin # = 3056, Bin count = 1
1F1 + 2F2 Freq = 21780.835, Bin # = 8092, Bin count = 1
1F1 - 2F2 Freq = 18227.8564, Bin # = 6772, Bin count = 1
2F1 + 1F2 Freq = 13555.1514, Bin # = 5036, Bin count = 1
2F1 - 1F2 Freq = 6449.19434, Bin # = 2396, Bin count = 1
Input freqs = 3160 + 5625.55
1F1 + 1F2 Freq = 8785.54688, Bin # = 3264, Bin count = 1
1F1 - 1F2 Freq = 2465.55176, Bin # = 916, Bin count = 1
1F1 + 2F2 Freq = 14411.0962, Bin # = 5354, Bin count = 1
1F1 - 2F2 Freq = 8091.10107, Bin # = 3006, Bin count = 1
2F1 + 1F2 Freq = 11945.5444, Bin # = 4438, Bin count = 1
2F1 - 1F2 Freq = 694.445801, Bin # = 258, Bin count = 1
Input freqs = 3160 + 10002.2
1F1 + 1F2 Freq = 13162.1704, Bin # = 4890, Bin count = 1
1F1 - 1F2 Freq = 6842.17529, Bin # = 2542, Bin count = 1
1F1 - 2F2 Freq = 16844.3481, Bin # = 6258, Bin count = 1
2F1 + 1F2 Freq = 16322.168, Bin # = 6064, Bin count = 1
2F1 - 1F2 Freq = 3682.17773, Bin # = 1368, Bin count = 1
Input freqs = 5625.55 + 10002.2
1F1 + 1F2 Freq = 15627.7222, Bin # = 5806, Bin count = 1
1F1 - 1F2 Freq = 4376.62354, Bin # = 1626, Bin count = 1
1F1 - 2F2 Freq = 14378.7964, Bin # = 5342, Bin count = 1
2F1 + 1F2 Freq = 21253.2715, Bin # = 7896, Bin count = 1
2F1 - 1F2 Freq = 1248.92578, Bin # = 464, Bin count = 1
Bin Totals:
Sample rate = 44100 Hz
5 Fundamental & Harmonic Bins filled with 5 components.
58 IM Bins filled with 58 components.
63 Total Bins filled with 63 components.
The AP uses this list as a sweep table to request the level in each bin and to graph the results.
The problem then is how to interpret the results.....
Any suggestions?
Jan Didden
janneman said:... The problem then is how to interpret the results.....
Any suggestions?
Jan Didden
Hi,
No suggestions on how to interpret. Maybe apples and
oranges. I use Spice FFT and visually inspect.
A 2tone (like 19Khz - 20Khz) seems to produce much the
same results.
With Spice you don't want to pick too many frequencies or
else the skirts of the neighboring frequencies overlap too much
and you don't get good resolution. You can also
reduce the skirts on individual frequencies by increasing the
simulation time.
Mike
john curl said:Do you have the IM bi-products of a B minor 7th chord? 😉
Surely you're joking Mr. Curl 😉
Jan Didden
mfc said:
Hi,
No suggestions on how to interpret. Maybe apples and
oranges. I use Spice FFT and visually inspect.
A 2tone (like 19Khz - 20Khz) seems to produce much the
same results.
With Spice you don't want to pick too many frequencies or
else the skirts of the neighboring frequencies overlap too much
and you don't get good resolution. You can also
reduce the skirts on individual frequencies by increasing the
simulation time.
Mike
Mike,
I'm trying to get this running on AP hardware. Because the FFT is totally synchronous, and all the freq bins are known, there's no windowing required and no 'skirting'. I had to buy the memory extension board for the AP System One, 24 bit * 8k, which cost me ... 500 $ US only. Because the board was reworked. If harddisks would cost the same per bit, you would probably need the entire national product of the US for just a single 120Gb drive.
In hindsight, I could probably have back-engineered that wimpy mem card, but the problem with hindsight is that it always comes after the fact. Oh well.
One way to evaluate the result is to add the root-mean-square of the values in all distortion bins, divided by the number of bins. As an absolute value, it probably is not worth much more than a classical THD value, but what I hope to see is clear differences with this method between amps that measure the same classical THD.
Jan Didden
My answer yesterday somehow got lost due the server downtimes...
Regarding SPICE, one can do IMD/multitone tests directly, by processing the output of an approbriate .FOUR (which seems to be window-less per se). I described this here:
http://www.diyaudio.com/forums/showthread.php?postid=1349571#post1349571
With real amps, I think it is straightforward that we will see differences among amps with same THD when a complex multitone is used, I would even suspect to see differences with same HD profiles. Now lucky AP rig owner Jan can co ahead to investigate this further...
The rest of us AP-less mere mortals will need to do this type of measurement with a bit more of manual operation/effort involved, but it is still doable. I already have a generator software (C-quicky) that allows me to produce sines and multiones on exact bin frequencies (for sync. averaging) and it could easily put out the involved IM bins (as of now, a spreadsheet does it). The averaging counterpart is also at hand.
Then a good FFT-Sofware like SpectraLab can process the data and it has an export feature to further work on the output with a spreadsheet....
- Klaus
Klaus,
I think you are ahead of me...
One limitation of the AP S1 is 48kHz sampling max so 24kHz max.
Jan Didden
I think you are ahead of me...
One limitation of the AP S1 is 48kHz sampling max so 24kHz max.
Jan Didden
Jan,
it's only a lead on paper (if any at all), as my PC soundcard can do 24/96k (at moderate performance), the best results I also only get at 48k. And the real goodies of the AP1, like the swept notch filter and in general the known and well-documented behaviour make this system what is is, a (hopefully) reliable precision device. A PC/soundcard solution is only good for coarse estimations, it can detect trends or is quite ok to look at before/after comparsions, but it is by no means something reliable and accurate in absolute terms. When I will try a different sound card (ESI Juli@ is one that looks promising) I expect things to be way different when I measure the same DUTs.
BTW, is there some info (on the web) on the AP's notch filter details, especially how the tracking is accomplished, and the circuit principle in general?
- Klaus
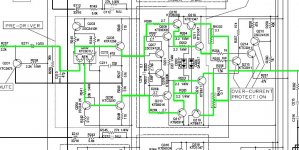
I saw this, and it's new to me. There's no CCS to power differential pair and VAS. Q204 and Q206 are current mirror with gain. The standing current is defined by 33k resistor.
R240 and R244 also terminated before the power rail.
What is the advantage of this arrangement?
R240 and R244 also terminated before the power rail.
What is the advantage of this arrangement?
Attachments
Looks like 1 less transistor advantage. Maybe somebody
trying to be novel - notice how odd the schematic is drawn.
trying to be novel - notice how odd the schematic is drawn.
lumanauw said:I saw this, and it's new to me. There's no CCS to power differential pair and VAS. Q204 and Q206 are current mirror with gain. The standing current is defined by 33k resistor.
R240 and R244 also terminated before the power rail.
What is the advantage of this arrangement?
It looks like the common-mode voltage of the input differential pair is being deliberately allowed to slightly modulate the VAS current source. Why, I don't know. Looks like he was drunk when he drew the output stage 🙂.
Cheers,
Bob
Looks like it. To get more harmonic distortion?It looks like the common-mode voltage of the input differential pair is being deliberately allowed to slightly modulate the VAS current source.
Pros and Cons of THD measurement
In another thread (“Total Harmonic Delusion”) the value of THD measurements was brought into question. While vanishingly low THD is neither necessary nor sufficient for an amplifier to sound superb, it is a very valuable metric for getting there.
If you have achieved very low THD from 20 – 20 kHz at all power levels into a variety of resistive and reactive loads you have assured very good linearity and good amplifier behavior under the conditions where it was measured. Properly measured very low THD leaves very little room for other distortions to be present.
This is not to say that other distortion measurements should not be done, however, such as SMPTE IM and CCIF IM. Some other distortion measurement techniques may better exercise the underlying nonlinearity, or reveal with more sensitivity the resulting symptomatic distortion residual. But setting the bar low for THD will usually help assure that these other distortions are not present in significant quantities.
THD is a symptom of nonlinearity. Some other distortions may be subjectively more objectionable than harmonic distortion, but it is very difficult for them to be present when the levels of thoroughly-measured THD are extremely low. The relative absence of THD helps to unmask these other distortions.
By the same token, many amplifiers, especially VT amplifiers, may have very good sonics even though they have substantial amounts of THD; their THD distortions may be benign sonically. This does not mean that THD is of little value in general, it just means that when THD is on the order of 0.05% to 1% we simply don’t know about other distortions that may be masked by benign THD.
The biggest problem with THD is that it is not often measured as thoroughly as described above.
Below are the reasons why a very low level of thoroughly-measured THD is desirable:
1) It assures exceptional overall circuit linearity under static conditions.
2) It virtually guarantees the absence of TIM, especially if the amplifier is known to have a healthy slew rate of, say, 50 V/us or more depending on power rating.
3) It assures that other distortions will be very small as well. These include CCIF IM and SMPTE IM and Phase Intermodulation distortion (PIM). This is especially so if the THD residual has been evaluated on a spectrum analyzer and if the THD has been measured in a bandwidth that is at least 10 times that of the fundamental.
4) It virtually guarantees the absence of audible crossover distortion. This is especially so if THD without noise is shown to be low at lower power levels by the use of spectral analysis of the residual. There is also a stronger assurance if the measurements include a 2-ohm load.
5) It strongly suggests that many low-frequency thermal distortions are absent or small when 20 Hz THD is very small. These include fuse distortion, feedback resistor thermal distortion and transistor junction thermal distortion.
6) It largely assures that measurable capacitor distortions, such as from electrolytics at low frequencies, are absent. This especially includes distortion in feedback shunt-leg electrolytics.
7) It virtually guarantees that magnetic coupling distortions from power supply rails is very low. Magnetic coupling of the highly nonlinear half-wave-rectified signal currents in Class AB output stages readily shows up as high-frequency THD.
8) It assures that power supply coupling distortions from limited PSRR are very low.
9) It virtually guarantees that power supply ripple and its harmonics are not entering the signal path. These will show up in the distortion residual even though they are not harmonics of the fundamental signal stimulating the amplifier.
10) It assures that ground-induced distortions due to imperfect grounding are very low.
11) It suggests that parasitic oscillations are absent driving the load used in the test setup. In thorough testing, these THD tests should be done into capacitive loads and simulated speaker loads. The presence of parasitic oscillations usually cause subtle increases in THD.
12) Finally, low THD into a 2-ohm load assures that the amplifier has very good high-current capabilities. Effects of beta droop in the output stage will often be unmasked in this THD test.
13) The attention to design detail and implementation necessary to achieve very low THD will tend to result in a better amplifier (as long as something stupid is not done to achieve low THD at the expense of something else).
Low THD does not assure the absence of other sonic degradations like the following:
1) It does not reveal distortion resulting from thermal bias instability, as when an output stage becomes temporarily under-biased following a high-power interval.
2) It does not assure civilized amplifier behavior under clipping conditions.
3) It does not assure civilized amplifier behavior when protection circuits are activated.
4) It does not assure that there is no flabby low-end performance due to a sloppy power supply.
5) It does not assure the absence of frequency response coloration due to the effects of frequency-dependent variations in load impedance.
6) It does not assure the absence of sonic degradation due to poor transient performance and ringing.
7) It does not assure the absence of sonic degradation due to unforeseen interactions with the loudspeaker load under dynamic conditions.
8) It does not assure the absence of instability under all possible cable and loudspeaker loads.
9) It does not assure that the amplifier is reproducing music faithfully in the presence of EMI ingress via the input, speaker or mains ports of the amplifier.
10) It does not address other linear and non-linear distortions that are less well-understood, such as sonic degradations due to passive component quality.
11) There are other amplifier mis-behaviors that I am sure I have left out.
Cheers,
Bob
Re: Pros and Cons of THD measurement
Excellent review, thanks Bob!
To my experience, this is one of the toughest issues to fight against, when low THD performance is targeted. Douglas Self covered the basics in his book, Ch. 14 pp. 398 however one has to build and measure such an amp to really understand the magnitude of this effect. Nothing can be more dissapointing than experimenting and optimizing an amp that has 10ppm of distortion on the bench, only to find out having 200ppm once it's installed in the project enclosure.
There are lots of methods and ways to fight this evil effect, from PCB layout (prof. Cherry's "8" input stage layout topology) to twisting power wiring, keeping power wiring perpendicular to signal wiring, adding small loops in the wiring, etc... (and no, "non magnetic resistors" do not count). All these are essentially Maxwellian patches, pretty difficult to fully predict in the design phase. And even after a prototype is successfully completed, the final result can be barely blindly reproducible, not to mention any eventual changes. The problem is that one would need advanced equipment and measurements techniques to tweak the enclosure installation. Such equipment may not always be readily available in a DIY enthusiast lab...
On another forum it was brought to my attention that, allegedly, an ultimate way to fight against these evil magnetic effects would be to bring the power supply filter capacitors on the OPS board. Of course, other methods like twisting the power supply wiring would still apply...
This method has obviously the disadvantages of significantly increasing the OPS board area, keeping the electrolytics very close to the major heat source in the enclosure (I'm of course assuming on board power devices), difficulties in implementing a star ground topology (unless it's a dual mono design), etc...
One to another, I'm not convinced that this approach may bring an overall significant improvement. Do you have any insights or comments on this?
Excellent review, thanks Bob!
Bob Cordell said:
7) It virtually guarantees that magnetic coupling distortions from power supply rails is very low. Magnetic coupling of the highly nonlinear half-wave-rectified signal currents in Class AB output stages readily shows up as high-frequency THD.
To my experience, this is one of the toughest issues to fight against, when low THD performance is targeted. Douglas Self covered the basics in his book, Ch. 14 pp. 398 however one has to build and measure such an amp to really understand the magnitude of this effect. Nothing can be more dissapointing than experimenting and optimizing an amp that has 10ppm of distortion on the bench, only to find out having 200ppm once it's installed in the project enclosure.
There are lots of methods and ways to fight this evil effect, from PCB layout (prof. Cherry's "8" input stage layout topology) to twisting power wiring, keeping power wiring perpendicular to signal wiring, adding small loops in the wiring, etc... (and no, "non magnetic resistors" do not count). All these are essentially Maxwellian patches, pretty difficult to fully predict in the design phase. And even after a prototype is successfully completed, the final result can be barely blindly reproducible, not to mention any eventual changes. The problem is that one would need advanced equipment and measurements techniques to tweak the enclosure installation. Such equipment may not always be readily available in a DIY enthusiast lab...
On another forum it was brought to my attention that, allegedly, an ultimate way to fight against these evil magnetic effects would be to bring the power supply filter capacitors on the OPS board. Of course, other methods like twisting the power supply wiring would still apply...
This method has obviously the disadvantages of significantly increasing the OPS board area, keeping the electrolytics very close to the major heat source in the enclosure (I'm of course assuming on board power devices), difficulties in implementing a star ground topology (unless it's a dual mono design), etc...
One to another, I'm not convinced that this approach may bring an overall significant improvement. Do you have any insights or comments on this?
rail induced distortion
Hi Bob and Ovidiu,
Magnetic coupling distortions from power supply rails can be cancelled by simple means, see:
http://www.diyaudio.com/forums/showthread.php?postid=1207205#post1207205 ,second paragraph and the circuit around P1.
This trick might save you a lot of headache
Cheers, Edmond.
Hi Bob and Ovidiu,
Magnetic coupling distortions from power supply rails can be cancelled by simple means, see:
http://www.diyaudio.com/forums/showthread.php?postid=1207205#post1207205 ,second paragraph and the circuit around P1.
This trick might save you a lot of headache
Cheers, Edmond.
Re: rail induced distortion
This link does not appear to be working, or the site is not acting correctly. Would you please correct or give more details of the post location?
Edmond Stuart said:
Magnetic coupling distortions from power supply rails can be cancelled by simple means, see:
http://www.diyaudio.com/forums/showthread.php?postid=1207205#post1207205 ,second paragraph and the circuit around P1.
This trick might save you a lot of headache
This link does not appear to be working, or the site is not acting correctly. Would you please correct or give more details of the post location?
Re: Re: rail induced distortion
Hi Pooge,
Sorry for the inconvenience. Must be a server bug, as no typo.
Anyhow, here are the details:
Thread: Bob Cordell Interview: BJT vs. MOSFET
Post # 1207
Date: 04-26-2007
Cheers, Edmond.
pooge said:This link does not appear to be working, or the site is not acting correctly. Would you please correct or give more details of the post location?
Hi Pooge,
Sorry for the inconvenience. Must be a server bug, as no typo.
Anyhow, here are the details:
Thread: Bob Cordell Interview: BJT vs. MOSFET
Post # 1207
Date: 04-26-2007
Cheers, Edmond.
Re: Re: Re: rail induced distortion
I'm afraid it's much more complicated than nulling a bridge around the GNFB pickup point, to compensate for layout asymmetries.
There are at least two mechanisms of magnetic induction, one related to power wiring induction (usually leading to even order harmonics) and another one related to PCB traces impedance change in the presence of metallic surfaces (usually leading to odd order harmonics).
But I'm sure your little pot does great in simulations.
Edmond Stuart said:
Hi Pooge,
Sorry for the inconvenience. Must be a server bug, as no typo.
Anyhow, here are the details:
Thread: Bob Cordell Interview: BJT vs. MOSFET
Post # 1207
Date: 04-26-2007
Cheers, Edmond.
I'm afraid it's much more complicated than nulling a bridge around the GNFB pickup point, to compensate for layout asymmetries.
There are at least two mechanisms of magnetic induction, one related to power wiring induction (usually leading to even order harmonics) and another one related to PCB traces impedance change in the presence of metallic surfaces (usually leading to odd order harmonics).
But I'm sure your little pot does great in simulations.
Re: Re: Re: Re: rail induced distortion
Indeed, it does great in simulations, and I'm pretty sure it also does so in practice. Of course it does not compensate for the other kind of magnetic induction (read odd harmonics), but that wasn't the subject.
syn08 said:I'm afraid it's much more complicated than nulling a bridge around the GNFB pickup point, to compensate for layout asymmetries.
There are at least two mechanisms of magnetic induction, one related to power wiring induction (usually leading to even order harmonics) and another one related to PCB traces impedance change in the presence of metallic surfaces (usually leading to odd order harmonics).
But I'm sure your little pot does great in simulations.
Indeed, it does great in simulations, and I'm pretty sure it also does so in practice. Of course it does not compensate for the other kind of magnetic induction (read odd harmonics), but that wasn't the subject.
- Home
- Amplifiers
- Solid State
- Bob Cordell Interview: Negative Feedback