The other way around, choose a reasonable complex circuit, simulate it at your best, publish the results, then build it yourself or wait somebody to do it and confirm by measurements the simulation results. Do this for a number of topologies and, if successfull, then you may buy yourself some confidence in your simulator and device models.
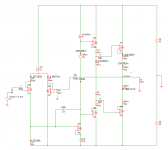
I simuated may amp at my best(not to experienced) and built it exactly as simulated. Only change(or add) were two 220pF capcitors connecte between drivers bases and emitters to tame Triple OPS oscilation. It was not shown in the simulation, not in transient nor in square wave simulation.
Only a problem I have here, I can't confirm simulated values with measured ones. I have function generator and oscillograf. I have intention to use a PC and a software to do the measurement, but I afraid that this could not show so low distortion as it was simulated.
THD-20k at 100W/8ohm 0.72ppm.
The link for my amp is here: http://www.diyaudio.com/forums/solid-state/182554-thermaltrak-tmc-amp-3.html#post2751316
dado
Hi Damir,
>Only change(or add) were two 220pF capacitors connected between drivers bases and emitters to tame Triple OPS oscillation.
The pre-drivers or the main-drivers?
Cheers,
E.
>Only change(or add) were two 220pF capacitors connected between drivers bases and emitters to tame Triple OPS oscillation.
The pre-drivers or the main-drivers?
Cheers,
E.
...were two 220pF capcitors connecte between drivers bases and emitters to tame
Hi Dadod,
how were changed sim results after putting those caps in your sim circuit?
Last edited:
Hi Damir,
>Only change(or add) were two 220pF capacitors connected between drivers bases and emitters to tame Triple OPS oscillation.
The pre-drivers or the main-drivers?
Cheers,
E.
Hi Edmond,
Main drivers(MJE15035,35)
Cheers
dado
Hi Antonio,
[snip]
Last but not least, I would ask you what happens when you put the output from LTspice (see below) by means of 10 separate sine sources (and summed together, of course) as input for the Cadence simulator. Normally, one should get THD=26.55ppm again. But in this case perhaps 200ppm or so?
Cheers,
E.
For completeness I just did it with MicroCap as well.
With a max. time step between 1ns and 100ns THD1k= 26.539ppm
and a max. time step between 1ms and 10ms (way too large) THD1k= 26.551ppm
So MC does what it is supposed to do and, equally important, without any troublesome tweaking of parameters (just as it ought to be).
Now let's see how other simulators perform.
Cheers,
E.
Hi Dadod,
how were changed sim results after putting those caps in your sim circuit?
Hi padamiecki,
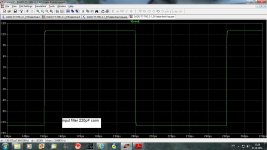
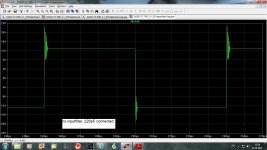
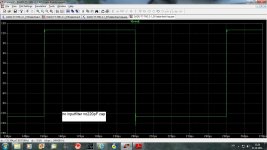
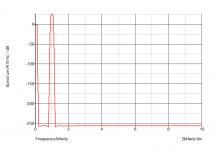
I did not notice differeces with the .tran test. With the square wave test there were some differences. Please comment, it looks worst with those caps but in practice thay are needed.
Diagrams below.
dado
Attachments

THD Results of Ideal CCCs component Cordell amp
Hello Edmond
Here is the results of the Cordell amp THD simulation using CCCS components, notice I have not included the output inductors to simulate the magnetic induced distortion as I dont know how to couple inductors yet.
Regards
Arthur
Hello Edmond
Here is the results of the Cordell amp THD simulation using CCCS components, notice I have not included the output inductors to simulate the magnetic induced distortion as I dont know how to couple inductors yet.
Regards
Arthur
Attachments
Hi Arthur,
Thanks for the sim. So THD is virtual zero.
As you have noticed, Antonio has probably nailed down the problem.
His simulator (Cadence) goes only mad when harmonics are present,
while in case of a pure sine the noise floor is okay.
Perhaps you are willing to repeat my sim with the ten sine sources (see post 3905).
Maybe your simulator goes mad as well.
BTW, As for the inductors, it's okay to ignore them. They only mimic the lead inductance of the power trannies and were not intended to simulate distortion as a result of magnetic induction. In order to do that, one must add more inductors (at the input for example) and define the coupling ratio (in case of a decent PCB lay-aout a very low value, of course).
Cheers,
E.
Dadod
What is the frequency of your measured oscillation?
How does it compare to the Amps cross-over frequency.
Namely is the oscillation a loop issue or a local instability with the follower?
For the simulator you might consider adding small inductors in series to the main driver bases to represent the actuals parasitic (as well as some output capacitance).
Thanks
-Antonio
Dadod
What is the frequency of your measured oscillation?
How does it compare to the Amps cross-over frequency.
Namely is the oscillation a loop issue or a local instability with the follower?
For the simulator you might consider adding small inductors in series to the main driver bases to represent the actuals parasitic (as well as some output capacitance).
Thanks
-Antonio
I could not stabilize the amp without those caps, so I don't know the frequency.
I suppose it was a local instability. Thanks for the advice I appreciate it.
dado
Edmond, Wally,Just to be clear, the only discrepency that I see from Wally's original comparison (LTspice to Cadence Ppsice) is the Cadence higher tabulated fourier components from the .Four output.The 2 FFT plots appear to be identical and correspond to the Ltspice .Four components. Note that this is still consistent with my observed errors with the Cadence FFT plots, in that I saw 20 to 5% errors (2nd and 3rd harmonics) which interestingly decreased as the distortion was lowered (so at least well within the error of interpretting from the supplied log plots).I think Wally later also observed the same behaviour in increasing the Cadence FFT resolition and decreasing its noise floor actually resulted in worsened .Four values.As far as which is correct, well I know that for my simple 4rth order polynomial test Ltspice was accurate, Cadence FFT was not and its .Four showed evidence of worsening with decreasing distortion levels (or at least needed a smaller max delta time)Hope this helps-Antonio
THD performance with 10 sine inputs ( as per post3900)
Hello Edmond
Here is the simulation with the 10 input sine wave signal from post 3900
As you can see the input THD is 0.00265473% and at the output THD is 0.00265483%. As can be seen the the output has virtually the same THD as the input. This is interesting.
Regards
Arthur
Hello Edmond
Here is the simulation with the 10 input sine wave signal from post 3900
As you can see the input THD is 0.00265473% and at the output THD is 0.00265483%. As can be seen the the output has virtually the same THD as the input. This is interesting.
Regards
Arthur
Attachments


Hi Antonio,
Indeed, the plot seems to be identical*, except the scale: rms vs peak values.
The numerical output on the other hand, is wrong, totally!
Happily, you observed that too. A rather embarrassing situation, in particular for those who repeatedly shouted that THD simulations are useless ("excreble" [sic]) and produce just noise.
Ironically, those skeptic guys, of all people, didn't look any further and draw the wrong conclusions. As said before: Only fools get fooled. 😀
Cheers,
E.
*I've checked only the amplitude of the 2nd harmonic.
Last edited:
Hello Edmond
Here is the simulation with the 10 input sine wave signal from post 3900
As you can see the input THD is 0.00265473% and at the output THD is 0.00265483%. As can be seen the the output has virtually the same THD as the input. This is interesting.
Regards
Arthur
Hi Arthur,
Thanks for the effort, but you have done too much. 😉
I meant just the THD of the sine source, i.e. without the synthetic amp.
Never mind. The outcome is still accordance with what would be expected.
edit: That leaves the nasty question, why your sim of Bob's amp predicted a much higher THD-1k (190ppm)
Cheers,
E.
Last edited:
Hello Edmond
>>edit: That leaves the nasty question, why your sim of Bob's amp predicted a much higher THD-1k (190ppm)
This is a very interesting question, as far as numerical computations Simetrix is good but you may notice from time to time I ask you questions about THD sims you do " what input level did you sim that with" I am attempting to compare results. I wish I knew what the difference was caused by.
Regards
Arthur
Dadod,
Do you have the same RC snubber values and inductor on the circuit output as the simulation?
Thanks
-Antonio
Do you have the same RC snubber values and inductor on the circuit output as the simulation?
Thanks
-Antonio
Dadod,
One last thing, I looked over one of your loop gain plots, and there is little gain margin and lots of phases changing near the cross-over.
Its a bit of a long shot but it would seem possible for the amp to oscillate during turn-on before the parameters have reached the levels in your ac simulation.
Thanks
Antonio
Dadod,
Do you have the same RC snubber values and inductor on the circuit output as the simulation?
Thanks
-Antonio
Antonio,
Yes all values are the same except resistor parallel to the inductor. It is 8.2ohm instead 2.7ohm, and I will change it as soon as I get one.
Thanks for your interest
Dado
Dadod,
One last thing, I looked over one of your loop gain plots, and there is little gain margin and lots of phases changing near the cross-over.
Its a bit of a long shot but it would seem possible for the amp to oscillate during turn-on before the parameters have reached the levels in your ac simulation.
Thanks
Antonio
Antonio,
Yes I know that Gain Margin is quite low, and that kind of phases changing is characteristic for TMC.
I did not notice any noise in the loudspeaker during turn-on, so I think there are is no oscilation.
Thanks again
Dado
- Home
- Amplifiers
- Solid State
- Bob Cordell Interview: Error Correction