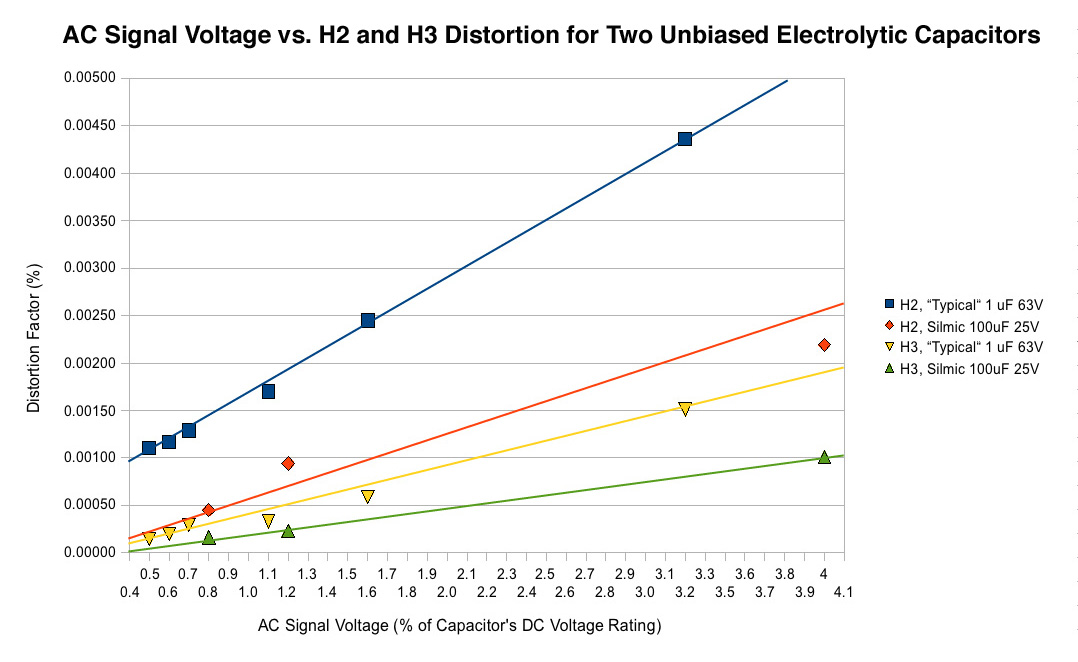
Note that the two caps I graphed were unbiased. This does not matter whatsoever for H3, which occurs wholly in response to AC signal voltage and is not significantly affected by DC bias. Thus, I believe this graph can be used alone to (very!) roughly estimate an electrolytic's H3 regardless of bias voltage. I should try to derive formulas for these vectors.
I think most caps' H3 would fall between the Silmic (representing best-case scenario) with most "Audio grade" caps tracking pretty closely above it, and less expensive general use caps performing more like the other unnamed (why?) cap, which Bateman called "typical" based on all of his measurements, most of which remain unpublished. Bateman passed away last year...RIP.
Figuring H2 will be more difficult since it depends on two variables.
X, what signal voltage did you use for your 1kHz sine wave when you made the FFT for Pocket Class A?
Last edited:
After further study...
Excellent job! I like the graphs, it's easy to see the y=x and y=(1/2)x relationships. But I doubt if it's that simple, the axes are probably not linear WRT one another, which turns a straight line into some flavor of quadratic curve.
Nelson Pass has an interesting article on distortion. You've probably seen it before, but I think it is related, in a few ways, to your efforts:
https://www.passdiy.com/project/articles/audio-distortion-and-feedback
Enjoy!
Thanks for the summary StellarElephant. The DC bias on the Pocket Amp is about 1.5v on the input side. Seems ideal for a Silmic II there. One of my first amps I used a 10uF MLCC ceramic (probably x7r) on the input and it had some of the worst distortion I have measured. I wonder if that was the cause.
Stellar (can I call you Cosmic Hippo?),
Thanks for Cyril's information on caps. This is informative for me; I'm always conflicted what to use and where, it's a conundrum this information helps resolve.
Hugh
Thanks for Cyril's information on caps. This is informative for me; I'm always conflicted what to use and where, it's a conundrum this information helps resolve.
Hugh
Stellar (can I call you Cosmic Hippo?)
Ha, ha. 🙂
Do you like the Bela Fleck album Hugh?
Well spotted Zia! I use it often to assess deep bass. ... along with Way Down Deep from Jennifer Warnes!
HD
HD
Well spotted Zia! I use it often to assess deep bass. ... along with Way Down Deep from Jennifer Warnes!
HD
Good choice sir! 🙂
700mV peak to peak.
Alrighty... (Warning: artist preparing to attempt mathematics!)
X, your sine wave was 0.7 volts, and the OSCON output cap is rated for 20V DC.
So the signal was at 3.5% of cap rating.
Using the chart, and assuming an OSCON performs somewhere in between a Silmic and a "typical cap", we might expect about 0.00125% H3 distortion factor from the cap.
The total H3 you measured from your amp during the test was -84dB, or 0.00631%.
.00125 / .00631 = .198
If I'm doing my math correctly, the OSCON contributed roughly 20% of the H3 you measured! 😱 That's actually a more significant amount than I expected!
Note: At this point I'm ignoring the fact that you used a WIMA MKS bypass on the output, which should reduce distortion at 1kHz by some amount TBD, at least with higher impedance cans. This reduction must be less than 50% (and even that would be with a perfect, non-distorting capacitor) assuming the two caps share the signal equally above bypass corner frequency, though I'm not positive that's how it actually works???
Last edited:
Excellent job! I like the graphs, it's easy to see the y=x and y=(1/2)x relationships. But I doubt if it's that simple, the axes are probably not linear WRT one another, which turns a straight line into some flavor of quadratic curve.
Nelson Pass has an interesting article on distortion. You've probably seen it before, but I think it is related, in a few ways, to your efforts:
https://www.passdiy.com/project/articles/audio-distortion-and-feedback
Enjoy!
Mlackey,
Thanks a lot for the Pass article. I look forward to reading it.
About distortion vs. voltage axes being quadratic, that certainly can be true. The only comparative graph that Bateman published in all of his articles illustrates this:
This is from pg. 8 of Cap Sounds #5. This chart actually uses the exact same data used in my graph, but only from the "typical" cap, not the Silmic.
I'm not positive about this, but I think the relationship becomes linear only when units are converted (as I did) to signal voltage as % of cap rating. Possibly converting to distortion factor % helped too. At least it looks pretty linear with the limited data (wish there was more...but I've included everything relevant).
I'm looking forward to finishing the Bias vs. distortion graph, but wifey says I have to finish my taxes!
Thanks for the encouragement, everyone.
I do like Bela Fleck too 😀
Attachments

Last edited:
I'm looking forward to finishing the Bias vs. distortion graph, but wifey says I have to finish my taxes!
It's good (and lucky) to have someone like that to keep the avid DIYer on track 😀
I do like Bela Fleck too 😀

Alrighty... (Warning: artist preparing to attempt mathematics!)
X, your sine wave was 0.7 volts, and the OSCON output cap is rated for 20V DC.
So the signal was at 3.5% of cap rating.
Using the chart, and assuming an OSCON performs somewhere in between a Silmic and a "typical cap", we might expect about 0.00125% H3 distortion factor from the cap.
The total H3 you measured from your amp during the test was -84dB, or 0.00631%.
.00125 / .00631 = .198
If I'm doing my math correctly, the OSCON contributed roughly 20% of the H3 you measured! 😱 That's actually a more significant amount than I expected!
Note: At this point I'm ignoring the fact that you used a WIMA MKS bypass on the output, which should reduce distortion at 1kHz by some amount TBD, at least with higher impedance cans. This reduction must be less than 50% (and even that would be with a perfect, non-distorting capacitor) assuming the two caps share the signal equally above bypass corner frequency, though I'm not positive that's how it actually works???
The distortion I measure is principally the product of the amp topology. The LTSpice distortion values predicted are pretty much in line with what I measure an dLTspice does not model distortion of caps (not for the generic ones I am giving it). So for all intents and purposes 0.001% is neglible when amp topology says THD is circa 0.05%.
The distortion I measure is principally the product of the amp topology. The LTSpice distortion values predicted are pretty much in line with what I measure an dLTspice does not model distortion of caps (not for the generic ones I am giving it). So for all intents and purposes 0.001% is neglible when amp topology says THD is circa 0.05%.
Right. So you're saying there is so much H2 that even 20% more H3 is still just a drop in the bucket? I'd imagine that caps really mostly just reinforce the overall harmonic signature of your amps, since they contribute more H2 than anything else.
Well so much H2 is just all relative. 0.05% distortion is 500 parts per million -66dB is the figure I shoot for when designing or tuning a SE Class A amp. Also I try to keep H2 about 10x greater than H3 plus the rest of which hopefully nothing higher than H4. That's about where an amp sounds good. You can try to get lower levels of distortion and people with 30 transistor amps and huge amounts of feedback can get 10 ppm distortion. But does it sound better? Anyhow, basically I am saying that if my amps are -66dB H2 and -88dB H3 I can sleep well at night. Maybe I will do a blind virtual audition of the same amp but with different caps to see if we can hear a difference. I know I hear a difference when I remove the cap completely. But not so sure when it's different caps. Maybe my next thread will do a recorded AB switch back and forth that is recorded. You will then see how hard it is to tell different between caps.
Last edited:
Bring it on, let's have a listen.But not so sure when it's different caps. Maybe my next thread will do a recorded AB switch back and forth that is recorded. You will then see how hard it is to tell different between caps.
Can we suggest particular tracks ?.
Dan.
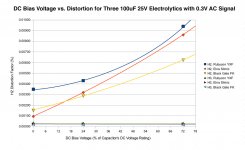
Here's DC Bias vs. Distortion with a 0.3V Signal
Such big gaps in the data are infuriating, but hey, the lines sure fit well this way!
This relationship is somewhat clearly quadratic, and I'm guessing mlackey is right that the last graph is too...just too subtle to notice there. Note how H3 is unaffected by bias voltage.

X, I don't want to choke your thread with irrelevant/insignificant stuff, so I'll start a new thread for the last couple graphs I plan to make from Bateman's measurments. Once I figure out a sensible way to cross-reference an AC vs. Distortion graph with a DC vs. Distortion graph, I'll report back here with my laughably crude prediction for capacitor H2 in the Pocket Class A!
Such big gaps in the data are infuriating, but hey, the lines sure fit well this way!
This relationship is somewhat clearly quadratic, and I'm guessing mlackey is right that the last graph is too...just too subtle to notice there. Note how H3 is unaffected by bias voltage.
X, I don't want to choke your thread with irrelevant/insignificant stuff, so I'll start a new thread for the last couple graphs I plan to make from Bateman's measurments. Once I figure out a sensible way to cross-reference an AC vs. Distortion graph with a DC vs. Distortion graph, I'll report back here with my laughably crude prediction for capacitor H2 in the Pocket Class A!
Attachments
Interessting could you find something which could explain break in? Some say that especially the bg need some time to "break in" - i'm not convinced that this is some physical process. But yes i've experienced some kind of break in... So i guess it is more a psychological adaption...anyhow would be interessting if there are some measurements backing one of this theories.
Break in on electrolytics could be the cap building up a thicker oxide insulating layer with use so the dielectric gets better with time?
Break in on electrolytics could be the cap building up a thicker oxide insulating layer with use so the dielectric gets better with time?
Agree. I've always heard that caps "deform" over time, and that really old parts may need time to "reform", if they do so at all. Unknown to me are the chemical reactions that cause "forming and "deforming", and X's idea is the best one I've heard to date.
- Home
- Amplifiers
- Headphone Systems
- BF862 based SE Class A Headamp without the HEAT