I do not have much experience with the speaker driver tolerance but the difference apears too big for a standard industrial product. Is it possible that the measurement technique could be the culprit?
I had checked with madisound, they say the difference is due to the low signal DAT v2 measurement system. I have made some FR measurements of the raw drivers in the enclosure, will take a look.
The difference that jumps out is one of the drivers having a DC resistance 20% larger than the specified 4.6 ohms. I would suggest comparing the DC resistance with a multimeter to confirm that one really is 20% larger than the other. If so, check the connections. If it persists I would be tempted to send the out of spec driver back.I had checked with madisound, they say the difference is due to the low signal DAT v2 measurement system. I have made some FR measurements of the raw drivers in the enclosure, will take a look.
If you use, say, a low voltage rather than a high voltage and a measurement procedure that measures and derives a different set of parameters then you should expect differences from the published parameters. However, the two drivers should still be close to each other even if they differ from the published specification. Over 20% (if confirmed) seems too far out of specification for a top of the range driver from a reputable manufacturer. I wonder if it may have been manufactured to a different specification for a customer. Are the labels on the drivers the same?
I would not expect any problems getting a pair of top of the range drivers sorted out. Did you show Madisound both sets of measurements or just the difference between one and the published specifications?
Last edited:
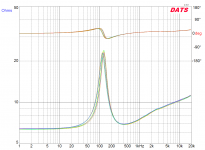
also can someone explain how to read the phase response curve?
Is the phase changing from 180 to -180 deg with freq?
Is the phase changing from 180 to -180 deg with freq?
The difference that jumps out is one of the drivers having a DC resistance 20% larger than the specified 4.6 ohms. I would suggest comparing the DC resistance with a multimeter to confirm that one really is 20% larger than the other. If so, check the connections. If it persists I would be tempted to send the out of spec driver back.
If you use, say, a low voltage rather than a high voltage and a measurement procedure that measures and derives a different set of parameters then you should expect differences from the published parameters. However, the two drivers should still be close to each other even if they differ from the published specification. Over 20% (if confirmed) seems too far out of specification for a top of the range driver from a reputable manufacturer. I wonder if it may have been manufactured to a different specification for a customer. Are the labels on the drivers the same?
I would not expect any problems getting a pair of top of the range drivers sorted out. Did you show Madisound both sets of measurements or just the difference between one and the published specifications?
The driver have the same labels, in fact successive serial numbers.
Also i did send them DATv2 impedance graphs (with params also listed) of both drivers along with seas datasheet
The multimeter check is telling you that the DC resistance is fine and the coils look to be the same in both drivers. Presumably this parameter is a derived by DAT v2 from other parameters that are measured/specified and so the deviation from 4.6 ohms is a measure of the error in the measurement procedure. 20% seems a lot for similar drivers and so I would look for a mistake somewhere.Did a quick check with multimeter and both show 4.6 Ohms.
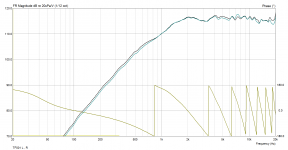
Here is the FR curve.
They seem fairly well matched, will check with DAT v2 again.
The frequency response looks reasonable and shows no significant differences in the drivers. Lots of phase wrapping like that at high frequencies is what happens when you have a significant time delay between the two signals as well as the phase shift due to the driver characteristics. This is many periods of the highest frequency but only a fraction of the lowest frequency. Your software probably has a way to relate the two signals to each other that removes most of the time delay.
also can someone explain how to read the phase response curve?
Is the phase changing from 180 to -180 deg with freq?
Phase change is normal 90º per filter order so 180º for a second roll off with 90º passed at -3dB fc.
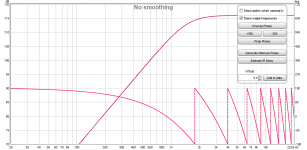
Picture 1 is a BW2 rolloff at 1500Hz and clear to see 90º point at 1500Hz and passband verse stopband is 180º apart.
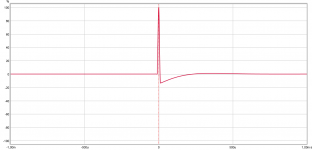
Picture 2 is IR belonging to picture 1, step is aligned time zero meaning no excess phase is wrapping and distorting phase plot in picture 1.
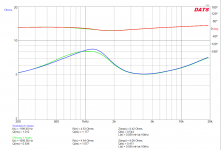
Picture 3 is same as picture 1 but manual moved IR minus 0,4mS to model excess phase, in REW the button you see named "Estimate IR Delay" will help put it back to zero point again.
So think what you see is excess phase in measurement chain such as time of flight and analog passband circuits delay, solution is get IR aligned and it will get better and reflect real phase.
Attachments

Last edited:
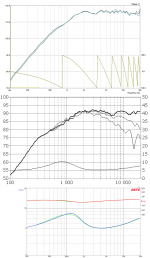
Regarding DATS results here some to compare that have no RE parameter problems, my DATS hardware is v1 and software updated to v2.
Picture 1 is a pair SS 10F/8424.
Picture 2 is 8 times Vifa TC9FD.
Mostly work with full rangers as mid/tweet but have one pair of tweeters laying around, request if you want to see how they compare each other.
Regarding DATS and my experience. Because its a ordinary sound device seen from Windows be sure not any programs such as browsers try to play to it when measuring, so think its best to close any programs when measuring. Check in Windows sound device control panel that both I and O is not by mistake been changed from default 44,1kHz setting. Version 2 hardware should be better but from plugged in give it at least a minute to warm up.
Attachments
I had checked with madisound, they say the difference is due to the low signal DAT v2 measurement system. I have made some FR measurements of the raw drivers in the enclosure, will take a look.
This may excuse differences in Vas or Qts, but not R and L. DATS is pretty accurate and consistent there.
Take a look at the impedance charts at the crossover region though, that's what matters. If the difference is that large there, I'd say there was a real driver mismatch.
I've tested about half a dozen driver pairs with DATS and have NEVER found them to be that far off.
If anything, I have found the Vas and Qts numbers from DATS better than published from SS. The SS numbers just don't make sense when you compare them to their published recommended enclosures.
Best,
Erik
The multimeter check is telling you that the DC resistance is fine and the coils look to be the same in both drivers. Presumably this parameter is a derived by DAT v2 from other parameters that are measured/specified and so the deviation from 4.6 ohms is a measure of the error in the measurement procedure. 20% seems a lot for similar drivers and so I would look for a mistake somewhere.
The frequency response looks reasonable and shows no significant differences in the drivers. Lots of phase wrapping like that at high frequencies is what happens when you have a significant time delay between the two signals as well as the phase shift due to the driver characteristics. This is many periods of the highest frequency but only a fraction of the lowest frequency. Your software probably has a way to relate the two signals to each other that removes most of the time delay.
Andy,
I think what you refer to is accomplished with dual channel measurements, where is software is possibly able to cancel out delays by sampling the amplifier output as well. Thanks.
Phase change is normal 90º per filter order so 180º for a second roll off with 90º passed at -3dB fc.
Picture 1 is a BW2 rolloff at 1500Hz and clear to see 90º point at 1500Hz and passband verse stopband is 180º apart.
Picture 2 is IR belonging to picture 1, step is aligned time zero meaning no excess phase is wrapping and distorting phase plot in picture 1.
Picture 3 is same as picture 1 but manual moved IR minus 0,4mS to model excess phase, in REW the button you see named "Estimate IR Delay" will help put it back to zero point again.
So think what you see is excess phase in measurement chain such as time of flight and analog passband circuits delay, solution is get IR aligned and it will get better and reflect real phase.
That is a clear explanation. I will play with the options in ARTA to see if i can compemsate for chain delays without using dual channel. I would need some accurate phase estimation to feed rephase to try the XOs.
Thanks much for the detailed explanation BYRTT.
Last edited:
This may excuse differences in Vas or Qts, but not R and L. DATS is pretty accurate and consistent there.
Take a look at the impedance charts at the crossover region though, that's what matters. If the difference is that large there, I'd say there was a real driver mismatch.
I've tested about half a dozen driver pairs with DATS and have NEVER found them to be that far off.
If anything, I have found the Vas and Qts numbers from DATS better than published from SS. The SS numbers just don't make sense when you compare them to their published recommended enclosures.
Best,
Erik
took the measurement again.
Attachments
Not necessarily. For one channel the the two signals are the input signal sent by the software and the output signal received by the software. There is a significant time delay between these two signals. If the software shifts one of the signals so it "lines up" with the other it will remove the time delay causing the wrapping around leaving a normal looking phase plot. How you do the "lining up" will determine what 0 degrees represents in the phase plot. I am not familiar with your particular software but most software will have the capability somewhere.I think what you refer to is accomplished with dual channel measurements, where is software is possibly able to cancel out delays by sampling the amplifier output as well.
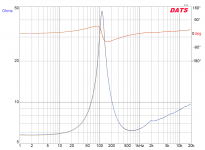
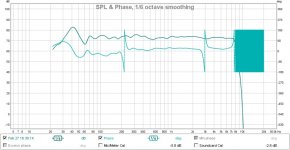
Not a specialist but imagine when resonance spike is so flattened by back chamber tech and also filled magnetic fluid then 3x Q parameters will fluctuate a bit, RE parameter now seems right.
For fun made below cut and paiste with datasheet for T25CF-001, parameter 'Free air resonance' little higher in frq than datasheet and peak a little lower.
For fun made below cut and paiste with datasheet for T25CF-001, parameter 'Free air resonance' little higher in frq than datasheet and peak a little lower.
Attachments
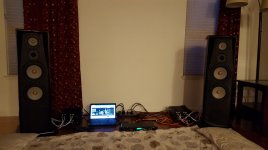
DAC is delayed, so i acquired a cheap Motu off craigslist and started tweaking the XOs.
After first round of tweaks and listening, this DSP version of modified RC4 sound fantastic. Few more issues remain to be ironed out and also to try out with the 9018 DAC once thats ready.
But these do sound incredible now.
After first round of tweaks and listening, this DSP version of modified RC4 sound fantastic. Few more issues remain to be ironed out and also to try out with the 9018 DAC once thats ready.
But these do sound incredible now.
- Status
- Not open for further replies.
- Home
- Loudspeakers
- Multi-Way
- Advice needed on 4 Way loudspeaker