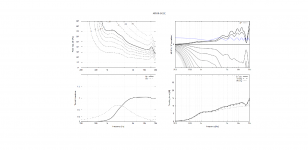
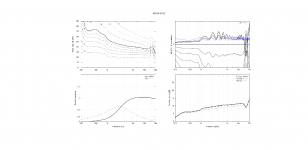
I continued to investigate the effect of 'Distance' variable (distance from source to microphone in ABEC3 sim). I found that even at very large distances (20m), I still had ripples on the on-axis response. That couldn't have been caused by simple Pythogoras as the difference from a point on-axis to 20m and R away from the axis to 20m is, well, the same.
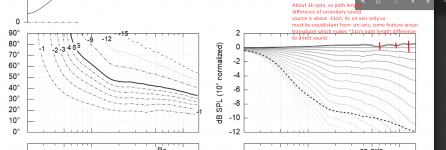
Then another mental image popped up. What if the interference ripple is the effect of sound going straight from the source to the microphone and sound that has traveled along the waveguide and diffracted at the end of the waveguide and went on its way to the microphone.
Here are two images of what ath (with ABEC3) has produced (with the dB axis of the SPL plot blown up to +-1dB) overlayed with the interference caused by the mental image introduced above:


It's not a perfect match, but I also don't think it's total bs either...
Edit: The amplitude is chosen such that it looks nice.
Then another mental image popped up. What if the interference ripple is the effect of sound going straight from the source to the microphone and sound that has traveled along the waveguide and diffracted at the end of the waveguide and went on its way to the microphone.
Here are two images of what ath (with ABEC3) has produced (with the dB axis of the SPL plot blown up to +-1dB) overlayed with the interference caused by the mental image introduced above:


It's not a perfect match, but I also don't think it's total bs either...
Edit: The amplitude is chosen such that it looks nice.
Last edited:
Yeah, thats how it works.
Since we are on simulator simulating a simplified ideal object without surrounding environment we can assume the ripple is most likely from diffraction. Diffraction is just sound going around edge of an object and when its hard edge compared to wavelength diffraction emits secondary sound backwards and opposite polarity. Anyway, there is very little reflection happening on objects like these and we don't see enclosure resonances, sound inside the enclosure leaking out somewhere etc. which could all be sources for secondary sounds in reality.
On simulator we have the pristine direct sound which is then followed by secondary sound(s) somewhere, in this case edge diffraction. When there is no secondary sound sources the frequency responses would look butter smooth as we are using ideal transducer as source on the simulator.
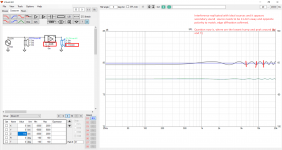
Conversely, if there is ripple in simulated graphs there is at least one secondary sound source somewhere and these are always late from direct sound. Viewed as frequency response we see their interference with direct sound, ripple. If you check out period of the ripple you can estimate the path length difference resulting it. Amplitude of ripple indicates frequency response of the secondary sound assuming direct sound is flat. These sims are kind of easy to imagine through as there is so little ripple left, basically just edge diffraction.
I use VituixCAD ideal sources to match ripple on graphs I want to investigate to find path length difference quickly without touching math. Also, using attenuation/EQ there gives estimation of amplitude of secondary source, again without maths 🙂 Basically it is tunable secondary sound source which I tune to match situation I'm inspecting and to find out parameters responsible for the ripple.
Of course sometimes situation is quite complex so simple single secondary sound might be hard to see amongst many. Using assumptions listed above and knowing that sound diffracts on physical features that do not approximate sphere compared to wavelength helps immensely. This is also from sims by the way, turn edge into big enough arc / roundover and diffraction related sound source goes away. Diffraction still happens, sound goes around the object, but it just doesn't emit the "backwave".
Last edited:
It might smoothen the responses some by distributing the wavelength difference to the edge but it would still make secondary sound source 🙂
Something like that popped into my mind also.
I guess you're gonna tell us...So what about this?
Yea but if you scatter the diffraction both in space and time you basically make it benign.It might smoothen the responses some by distributing the wavelength difference to the edge but it would still make secondary sound source 🙂
This is the code, I haven't tried yet. It might need some tweaking to work properly.
Code:
R-OSSE = {
  R = 130.0
  r0 = 12.7
  a0 = 7.5
  a = 39
  k = 1.8
  r = 0.3
  b = 0.3
  m = 0.8
  q = 3.7
  tmax = 0.95 + 0.1*sin(10*p)^2
}

Mesh.LengthSegments = 50
Mesh.AngularSegments = 100
Mesh.SubdomainSlices =
Mesh.WallThickness = 5

ABEC.SimType = 2
ABEC.MeshFrequency = 100
ABEC.NumFrequencies = 40
ABEC.Abscissa = 1
ABEC.f1 = 2000
ABEC.f2 = 20000

ABEC.Polars:SPL = {
  MapAngleRange = 0,180,37
  NormAngle = 10
}

Output.ABECProject = 1
Output.STL = 0

Report = {
  Title = ST260-ROSSE
  Width = 1200
  Height = 1040
  GnuplotCode = 3x2nc.gpl
  MaxRadius = 150
}
Last edited:
Quick example for this, some image from the thread, lets estimate secondary sound source:...
I use VituixCAD ideal sources to match ripple on graphs I want to investigate to find path length difference quickly without touching math. Also, using attenuation/EQ there gives estimation of amplitude of secondary source, again without maths 🙂 Basically it is tunable secondary sound source which I tune to match situation I'm inspecting and to find out parameters responsible for the ripple.
...

Then replicate the ripple in vituixcad

We learn that the secondary sound is attenuated about 30db or so and indeed about 11cm path length difference to direct sound. Also we learned secondary sound has opposite polarity so it must be diffraction backwave. Now its possible to esimate what might be the cause and if its something that needs to be addressed somehow.
Cool trick with tmax!🙂Yea but if you scatter the diffraction both in space and time you basically make it benign.
This is the code, I haven't tried yet. It might need some tweaking to work properly.
Code:R-OSSE = { R = 130.0 r0 = 12.7 a0 = 7.5 a = 39 k = 1.8 r = 0.3 b = 0.3 m = 0.8 q = 3.7 tmax = 0.95 + 0.1*sin(10*p)^2 } Mesh.LengthSegments = 50 Mesh.AngularSegments = 100 Mesh.SubdomainSlices = Mesh.WallThickness = 5 ABEC.SimType = 2 ABEC.MeshFrequency = 100 ABEC.NumFrequencies = 40 ABEC.Abscissa = 1 ABEC.f1 = 2000 ABEC.f2 = 20000 ABEC.Polars:SPL = { MapAngleRange = 0,180,37 NormAngle = 10 } Output.ABECProject = 1 Output.STL = 0 Report = { Title = ST260-ROSSE Width = 1200 Height = 1040 GnuplotCode = 3x2nc.gpl MaxRadius = 150 }
Regarding scattering diffraction yeah its amplitude gets less on frequency response graph but there is still same amount of energy going to the edge and diffracting. It is now kind of distributed to different frequencies due to varying path length difference, but there still is the secondary sound and about same total amount of it. I have no idea if this is more or less audible or is it audible at all and on what conditions. To really get absolute best performance we need to eliminate secondary sounds altogether, but I have no idea if there is audible difference in reality between 0% secondary sounds to ~0.1% secondary sounds.
And that's why I came up with the round over dumping the sound in an absorber. Don't know how to simulate that and I'm not even at a percent of the speed of mabat trying wild ideas.
That's what diffusers do, don't they. They scatter strong reflections into what's perceived much better.Regarding scattering diffraction yeah its amplitude gets less on frequency response graph but there is still same amount of energy going to the edge and diffracting. It is now kind of distributed to different frequencies due to varying path length difference, but there still is the secondary sound and about same total amount of it.
^^ Tom, but the absorber would need to be front side of the device to attenuate diffraction "backwave" 😉 Diffraction "backwave" launches at the edge and to absorb it you'd need the absorber front of the edge, which would affect sound to the edge and so on. It would be better to remove the edge altogether Its easy to remove for high frequencies as small roundover is effective meaning that the high frequencies are easy to get rid off diffraction but the device size wavelength we have no other option than to round edges off, make the whole device approximate sphere.
Last edited:
Yes intuitively so, I'm no expert but can imagine diffusers turn part of "harmful" early reflection energy to "helpful" late reverberant energy. What would have bounced directly to listener is now partially scattered around the room toward longer paths.That's what diffusers do, don't they. They scatter strongly localized reflections into what's perceived much better.
Same happens here of course on the waveguide lip, but the path length varies only tens of microseconds instead of optimally many milliseconds. I'm not sure if they are comparable in this way. Waveguide is rather small so any secondary sound sources happen about within first 1ms if they are scattered or not.
But the principle is the same so it should be a move in the right direction. We saw already that even a few centimeters make a difference here.
I guess so it would help, but really I have no idea what is audible and what is not so perhaps its all academic. I'm fixated on spotting secondary sounds from graphs and trying to eliminate them, wiping them under carpet does not satisfy my fixation 😀
Perhaps they are already low enough in level with all smooth ath waveguides like ST260, really liking sound of it. Definitely smooth DI so the diffraction is doing work instead of being mere "bad sound". But still, as its a hobby I plan to make device without secondary sounds and try if its any better just because its interesting, and perhaps cure the fixation of mine 🙂
And totally, very small changes in waveguide profile can make huge difference in response.
Last edited:
Not a simple task to create such a model but I guess it could be perforated towards the back with larger and larger holes (or some similar structure).
It's quite small model so I ran it again. Still not perfect but I'd more than happy.
(Together with the B&W version of the report.)


The sequence could be made more random. I'll try to figure out how.
(Together with the B&W version of the report.)
The sequence could be made more random. I'll try to figure out how.
Perhaps but usually tricks come with some trade-offs. I'm thinking sphere is the ultimate shape for least interference and that got me already perfect device, whose pattern I'd like to tweak as its beam machine 😀 Not sure if its possible but will try. Cubic bezier for backside definition in ath would be just the right tool I think, hopefully you release it someday 🙂Not a simple task to create such a model but I guess it could be perforated towards the back with larger and larger holes (or some similar structure).
- Home
- Loudspeakers
- Multi-Way
- Acoustic Horn Design – The Easy Way (Ath4)