60, 90, 120 deg nominal coverage angles (1" throat, 10 kHz) -
Attachments
Last edited:
I use the software quite a lot but still don't have a clue what's really happening 🙂... It can take time, does not matter, but it would be beneficial to not only use the Ath software, but really know what is happening.
- I will try to return back to your questions, it's not an easy answer.
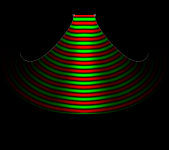
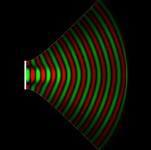
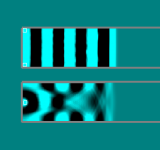
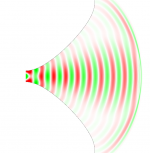
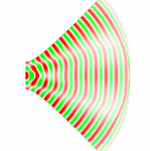
What you are seeing are near field effects. What is more interesting is the far field and that is not obvious from the coarse near field plots.
The problem with an angled wall is called spatial aliasing and it occurs when the wavelength become comparable to the feature size (staircase approximation to an angled wall.) Lower the frequency or increase the spatial resolution and this will go away.
The problem with an angled wall is called spatial aliasing and it occurs when the wavelength become comparable to the feature size (staircase approximation to an angled wall.) Lower the frequency or increase the spatial resolution and this will go away.
The ripple tank has one tool against the reflections at the edge of the screen. It does damping, but it figures loss everywhere at once, spread over time. So it effectively leans toward the source. Not perfect, but sometimes you don't have much choice.
This is a hard-to-overcome problem when driven with a short pulse, isn't it. That was my idea, to observe how a short pulse propagates through the device and see what other waves emerge along the way. This would expose very clearly, IMHO, all the internal diffractions and higher modes, which are otherwise buried pretty deep under the fundamental (when driven with a sine wave, for example).... Lower the frequency or increase the spatial resolution and this will go away.
Last edited:

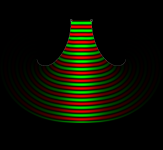
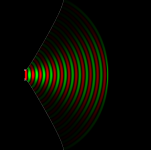
When calculated in ABEC, far field intensity was always highest on-axis, with lobes corresponding to the number of nulls in the driving mode. This is nothing like it - what's wrong? Could be my interpretation 😕
Attachments

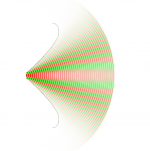
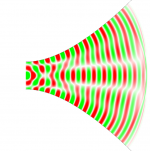
Yes, I want to see how the higher order duct modes develop in the waveguide. I have already simulated that via BEM in ABEC.
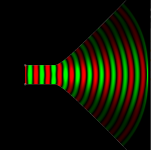
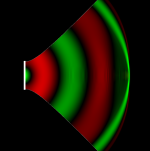
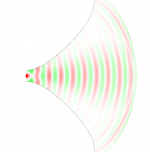
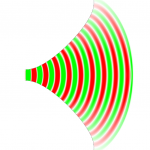
Here's the mode (0,2) - if the frequency is low enough, the source wavefront doesn't really matter. Unfortunately, I can't go much higher because of the "spatial aliasing" problem.
Here's the mode (0,2) - if the frequency is low enough, the source wavefront doesn't really matter. Unfortunately, I can't go much higher because of the "spatial aliasing" problem.
Attachments
Last edited:
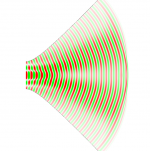
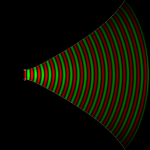
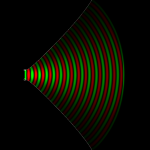
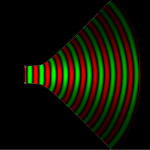
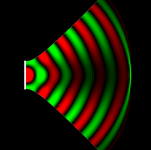
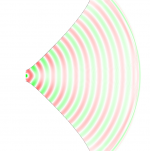
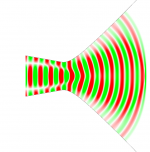
The same for a lower frequency -
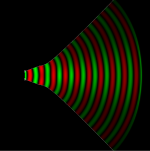
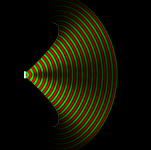
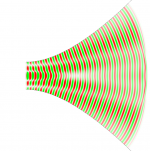
Now I start to recognize the pattern - it's the deviation of the resulting wavefront from spherical that one should look at - that's where are the polars observed (i.e. on a circle around the source). That will make the "lobes" and the switching of polarity we saw in the far field polars.
Now I start to recognize the pattern - it's the deviation of the resulting wavefront from spherical that one should look at - that's where are the polars observed (i.e. on a circle around the source). That will make the "lobes" and the switching of polarity we saw in the far field polars.
Attachments
Last edited:
Is it the Falstad ripple tank code that is used in Hornresp?
//
Yes: Transmission line 'flow simulation'
- Home
- Loudspeakers
- Multi-Way
- Acoustic Horn Design – The Easy Way (Ath4)