To mess up it all I exported the impulse response I talked about and opened it up in WinMLS2004(L5)...
Different story - completely....
When I have the time I´ll try to do some comparation in form of text and pictures.
Different story - completely....
When I have the time I´ll try to do some comparation in form of text and pictures.
As long as your head is locked in a vise 😉.
this is true...though that expression can be exaggerated in some situations
That would be great.When I have the time I´ll try to do some comparation in form of text and pictures.
I would like use ATH4 to design a waveguide for ribbon tweeter. It has a rectangular aperture. Can ATH4 be used to generate a rectangular profile waveguide?
No, that hasn't been implemented.I would like use ATH4 to design a waveguide for ribbon tweeter. It has a rectangular aperture. Can ATH4 be used to generate a rectangular profile waveguide?
You are strange.
Most people who can actually think outside the box....are =)
Could you show how does it look like in your case when you let some reflection(s) enter the IR window?
here is my truth 2031a with the IR window out too wide. you can see the ripples in the excess phase plot caused by me opening the window up. its much smoother (but not perfect ) if I window the measurement properly
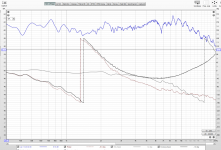
Just because something is objectively true in isolation does not mean that you can extrapolate it out to determine that more of a good thing must be better. This is why it is an over simplification in the context of the perception of an entire audio system.its not over simplified its scientifically objective
Isn't the minimum phase more smoothed, compared to the measured phase? It seems odd to me that it should be that smooth, looking at the amplitude response. That would also cause all the small ripples in the excess phase.here is my truth 2031a with the IR window out too wide. you can see the ripples in the excess phase plot caused by me opening the window up. its much smoother (but not perfect ) if I window the measurement properly
View attachment 932219
Last edited:
HOM is not a resonance but a different way for a sound wave to propagate in a waveguide.
Is it like shown in this lab/demo? Showing cut-in of the modes.
Evanescent Modes in a Waveguide - YouTube
/örjan
Last edited:
Isn't the minimum phase more smoothed, compared to the measured phase? It seems odd to me that it should be that smooth, looking at the amplitude response. That would also cause all the small ripples in the excess phase.
yeah sorry you're correct. didn't recalculate the min phase response
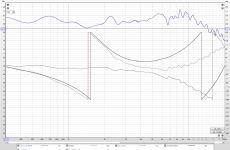
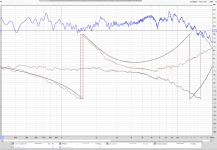
here are the before and after. 3ms gate and 20ms I suppose this means that everything pretty much in this measurement is minphase? If i do the same thing with a room measurement of the same speaker then the excess phase has MASSIVE wraps in it
Last edited:
There's the excess phase due to the crossover (what makes the central "wrap") but that's about all I can see.
BTW, in your measured phase the pure delay is over-compensated. The right amount of compensation should render the phase curve flat above the pass band of the device (i.e. group delay should approach zero for infinite frequency). If it's bending upward, it's clearly over-compensated. It doesn't really matter for much of the analysis but it looks a bit weird.
Maybe for a better readability it makes sense to show the excess group delay, i.e. taking group delay of the excess phase.
- Now I'll have to think more about this because obviously it shows nothing interesting. It's not intuitive to me but it seems this is how it is.
Last edited:
@mabat, a bit of topic perhaps, sorry.
@geddes
I'm speaking out loud trying to understand, learn 😉
If we could have a source with all modes, could we not test for HOM by checking for frequencies disappearing below the cut-ot frequency of the waveguide?
/örjan
@geddes
I'm speaking out loud trying to understand, learn 😉
If we could have a source with all modes, could we not test for HOM by checking for frequencies disappearing below the cut-ot frequency of the waveguide?
/örjan
If we could have a source with all modes, could we not test for HOM by checking for frequencies disappearing below the cut-ot frequency of the waveguide?
Do you mean a source that excites all the modes? The modes always exist, but get excited to a variable degree depending on the nature of the wavefront. Below cut-in they will be evanescent and decay rapidly, they will only reach the mouth above cut-in unless the device is very short.
But the contrary view to what you say is to look for more frequency content above cut-in. It's easier to find something than to look for nothing.
In this thread, since the intent is to minimize these modes, they will be very hard to find - that's the intent!
I noted the depletion of delayed signals in the impulse when foam was added to the waveguide. This could be HOMs, but it could also be other things - a reflection off of the diaphragm for example. Since all of this gets melded together into a single response, it is difficult to sort out.
Maybe someone with a more fresh theoretical knowledge would know this - how is the frequency response supposed to change if we just repeat the impulse response and calculate the FR from that?
So it will be some comb filter but will it be minimum phase? It seems so.
What do you mean by "repeat"? You mean copy paste at different times?
Yes, good idea! These kind of software (Matlab, Octave, Mathematica, various Python packages, etc.) are just great when fiddling with physical concepts. A good option is Python + Numpy + Jupyter! That way I can share my horn code with somebody... 😛I think I have to install and finally start using Octave.
Yes, I meant to copy the (windowed) impulse response and paste it with some dalay after the first one, perhaps with a smaller amplitude.
Yes, I meant to copy the (windowed) impulse response and paste it with some dalay after the first one, perhaps with a smaller amplitude.
It looks like that for the second peak of half the amplitude:
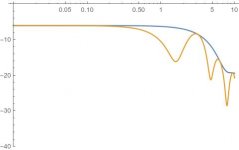
and phase:
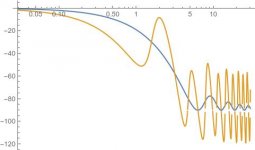

with the impulses given by:
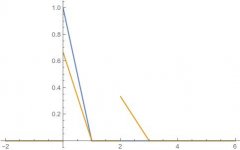

I haven't properly scaled the frequencies to anything but the behavior will be qualitatively the same.
Edit: Forgot to put the phase.
Last edited:
- Home
- Loudspeakers
- Multi-Way
- Acoustic Horn Design – The Easy Way (Ath4)