Every acoustic source has some power response (or "room") curve that can be in principle EQed to any other curve. That just doesn't tell you much - it would be too easy.
I'll try to show the total power or the DI curve in VACS, it's possible, only not very convenient. Maybe it could be automated from the (converted) polar map data.
I'll try to show the total power or the DI curve in VACS, it's possible, only not very convenient. Maybe it could be automated from the (converted) polar map data.
I need to build an universal vertical "lathe" for making axisymmetric molds and try all these out.
Once axisymmetric, it should be really easy.
The great thing is that all these high-resolution simulations take less than a minute each. I should have started with these...
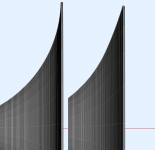
BTW, the circular profile is quite sensitive to the actual shape details. It is not automatically this smooth. If it was possible to make it slightly more CD, that would be awesome. Definitely, there's still room for experimentation.
Once axisymmetric, it should be really easy.
The great thing is that all these high-resolution simulations take less than a minute each. I should have started with these...
BTW, the circular profile is quite sensitive to the actual shape details. It is not automatically this smooth. If it was possible to make it slightly more CD, that would be awesome. Definitely, there's still room for experimentation.
Last edited:
BTW, the circular profile is quite sensitive to the actual shape details. It is not automatically this smooth. Definitely, there's still room for experimentation. If it was possible to make it slightly more CD, that would be awesome.
You seem to be making my points for me 😉
That said, the last horn should already provide satisfactory results.
Last edited:
It's very easy to get Vituix to do it, I read Nils document on how to do it in VACS and immediately looked for an alternative 🙂 I made an advanced renamer script to rename the text files exported from the Polar Curves to the format Vituix expects. It is only a hemisphere as that is all that comes out as standard. It could easily be expanded to a full spherical power response. I attached the script earlier in the thread.I'll try to show the total power or the DI curve in VACS, it's possible, only not very convenient. Maybe it could be automated from the (converted) polar map data.
That error is because something is referenced that does not exist. This might well be an Akabak vs ABEC issue. Don posted some information earlier on how to get the scripts to work with Akabak that might give you a place to start.A question:
I tried to run a modified demo11, but got these messages.
Any ideas?
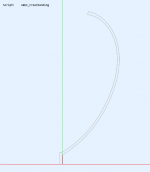
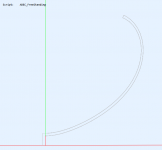
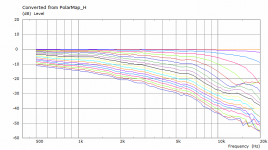
The last profile rotated 30 deg (anti-clockwise on the picture, i.e. "opening" the waveguide).
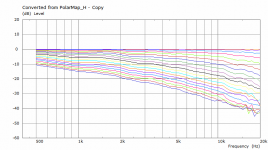
Seems like a strong higher order mode(s) cut-on above 10 kHz due to the throat wavefront boundary mismatch, perhaps?
Seems like a strong higher order mode(s) cut-on above 10 kHz due to the throat wavefront boundary mismatch, perhaps?
Attachments

Last edited:
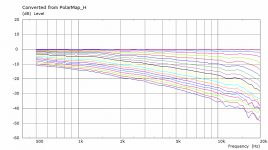
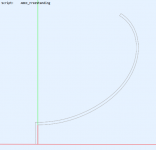
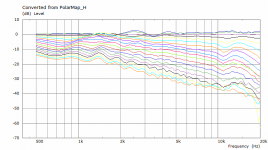
I tried a similar overall shape but with an OS throat - it's basically the same, if not even slightly better. The beam simply "breaks up" at some point if set too wide for what the throat size and the source wavefront allows.
Circular arc:

OS throat:

Circular arc:
OS throat:
Attachments
Last edited:
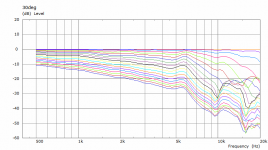
That bump at 5.5k is 'problematic'.
OS vs flat wavefront interference?
An 1" throat maybe better.
OS vs flat wavefront interference?
An 1" throat maybe better.
Last edited:
I should have probably shown the raw curves instead (not implemented for the CircSym yet), as these data are converted from normalized polar maps - by nature it will be more likely an axial hole than a bump off-axis. Don't forget this was for a 75 mm (3") throat to exaggerate it a bit.
Last edited:
Every acoustic source has some power response (or "room") curve that can be in principle EQed to any other curve. That just doesn't tell you much - it would be too easy.
Of course, in reality, as in 'real rooms', more specifically: average living rooms without (lots of) acoustical treatments, it's hardly ever easy.
Everything is related to the interdependence between electro-mechanical properties, acoustical parameters/circumstances, personal preferences and what have you.
My room isn't a treated studio. By something like "satisfactory results", I am referring to a reasonably optimized source (loudspeaker) which is less
likely to interact negatively with the average room. A big horn helps in this respect.
Last edited:
What I meant was that the power response curve alone does tell you nothing about the actual radiation pattern, for example how well are the reflections spectrally similar to the direct sound, what is their level, etc. An omnidirectional source or even a really bad source with a terrible radiation pattern can have exactly the same "room response" curve as a big waveguide, yet the sound including all its attributes can be subjectively very different.Of course, in reality, as in 'real rooms', more specifically: average living rooms without (lots of) acoustical treatments, it's hardly ever easy. ...
Last edited:
I've found a bug in the rollback feature - it works as absolute, not relative to the existing profile. When the rollback rate is set to zero, it actually straightens the profile instead of keeping it intact 🙂 To be fixed...
Attachments
Last edited:
What I meant was that the power response curve alone does tell you nothing about the actual radiation pattern, for example how well are the reflections spectrally similar to the direct sound, what is their level, etc. An omnidirectional source or even a really bad source with a terrible radiation pattern can have exactly the same "room response" curve as a big waveguide, yet the sound including all its attributes can be subjectively very different.
Indeed. Tom Danley's explanation here is clear and concise.
It would be interesting compare amount of reflections from:
1) cone driver with Berstis lens firing upward (omni)
2) ATH waveguide but L shaped (omni) - splitted wavefront
3) two side ATH waveguide both side of comp driver membrane (dipole)
1) cone driver with Berstis lens firing upward (omni)
2) ATH waveguide but L shaped (omni) - splitted wavefront
3) two side ATH waveguide both side of comp driver membrane (dipole)
Last edited:
I played with Berstis lens and SOBOL - it's slow 🙂 If you want use it as phase plug then in reverse - need code modification since original is constant aperture.
- Home
- Loudspeakers
- Multi-Way
- Acoustic Horn Design – The Easy Way (Ath4)