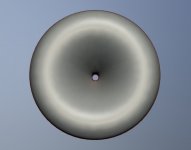
The horn in 2258 looks similar to the older pth 100x100 waveguide, but no straightish walls.
Looks nice.
Looks nice.

The first problem is whether they are numeric artefacts or not. Answering that is really not so easy, IME. Sometimes there are spikes in the data that are obviously not real, no matter what you do. Sometimes it is just flawless. There are several ways how to proceed in case there are suspitious ripples - either change or refine the mesh considerably (and wait...and wait) or at least concentrate all the frequency points you are willing to calculate to that range and run it again. In many cases the spikes will still be there, just a bit different, which would indicate noise. Sometimes even the ABEC's domain interface shape has an effect (which it really shouldn't but it does). As I see it, for it to be a real ripple, it would have to be spread across more data points if these are dense enough, i.e. it should capture the nature of the problem. As long as it is just a single data point (even at several angles), I just never trust it.... The smoother the polar curves the smoother the Radiation Impedance is. So in that sense the reason for the ripples in the graph is clear. Whether they will appear in reality is another question. I am not so sure that they are just sim artefacts that can be completely ignored if you are aiming to make the best waveguide possible through simulation.
Thanks for the data, it is refreshing to see someone else posting it! 🙂
Months ago, I got some smooth polars on some attempt on this program. Then tried to change the ABEC frequency range to something else keeping the horn formula the same and ripples appeared. My observation was that the intermittent ripples appear due to the discrete frequencies ABEC is configured to simulate on. Change amount of frequencies or low / high limit in your ATH config file and the frequencies used for the ABEC simulation change. So I think the ripples are real, sometimes they hide in between your simulated frequencies 😉
Last edited:
Soon we will see how much is that really necessary - I'm implementing the free-standing option. I hope that for the bigger waveguides it is not, because it's ugly 🙂An oldie, with roundover as suggested by jzagaya.
Last edited:
As long as it's only a single data point, you just can't be sure what is it. That it changes with different frequency points also doesn't tell you much - it can still be a numeric issue, just shifted "randomly". The only reliable way is to make the frequency resolution much denser - then you can at least judge if it's numerical noise or not. In case of noise, there can still be a real ripple underneath but you simply don't know.So I think the ripples are real, sometimes they hide in between your simulated frequencies 😉
Last edited:
...if it's numerical noise or not. In case of noise, there can still be a real ripple underneath but you simply don't know.
Boundary Element Methods are prone to solution anomalies.
As well as the usual "noise" from sensitivity in the calculation there are problems in the translation of the physical reality into the BEM formulation.
These are most evident in a simple or naive formulation of the model - there are ways to reduce or avoid the problem.
Apart from the fact they exist I don't know much about the details, the extra complexity is not what I would call obvious.
Is it mentioned how ABEC3 handles this?
It may provide a clue as to what to do when problems occurs.
Best wishes
David
To be honest, it used to annoy me at times but I learned to ignore it for the most part. Having seen a lot of BEM results to this day, maybe I already got a sense of what should worry me and what to ignore... When looking for overall trends, occasional spikes don't concern me. I know very little about the actual underlying models and techniques used.
Last edited:
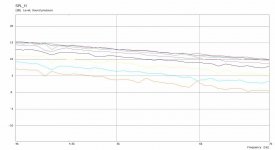
Here is one where everything looks quite good apart from one problem frequency, what do you think is going on here? Numerical instability or real issue?
Here is a medium density mesh
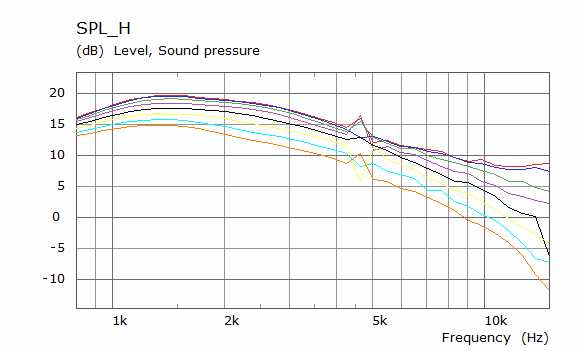
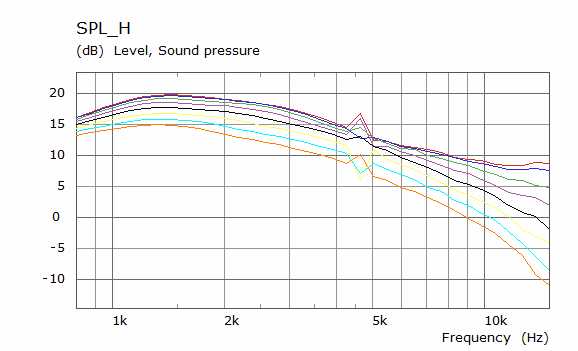
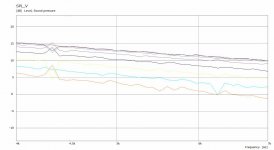
Then I made a much finer one to compare, most things are smoother but the problem area remains
Here is a medium density mesh
Then I made a much finer one to compare, most things are smoother but the problem area remains
Attachments
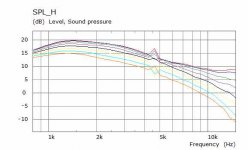
I bet on a "solution anomaly" as David mentioned. I can't imagine this could be real issue - it is so localized that I think this is not even possible. I would try to run it again limited to the range 4 - 5.5 kHz, with as many points as feasible (20 should suffice).
I have come across one small issue while simulating rectangular guides with cross shaped superformulas. Maybe this has come up before, I can't remember.
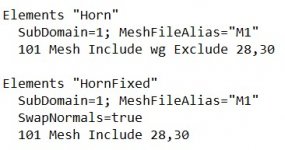
I seem to get some slices with reversed normals in the mesh from gmsh
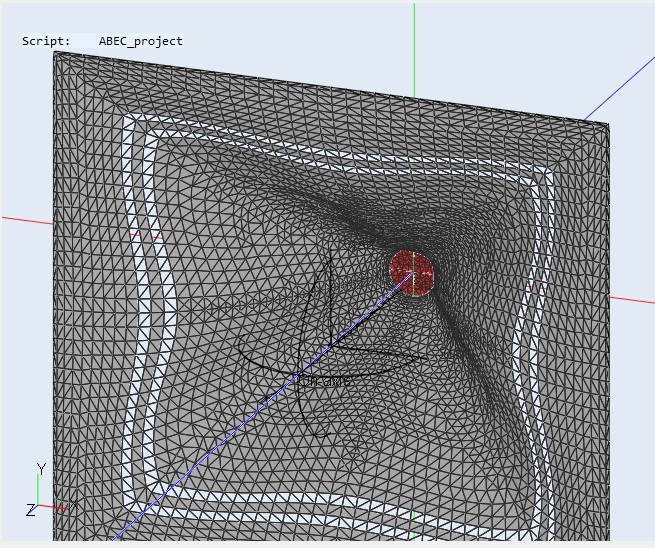
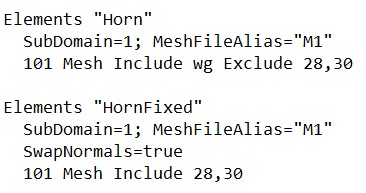
With some guidance from DonVK I was able to fix it easily. Clicking on one of the affected triangles in ABEC shows the element number which can them be excluded from the mesh and re-included with the normals swapped like this in the solving.txt
Problem fixed 🙂

Is it a bug or something I'm doing wrong?
I seem to get some slices with reversed normals in the mesh from gmsh
With some guidance from DonVK I was able to fix it easily. Clicking on one of the affected triangles in ABEC shows the element number which can them be excluded from the mesh and re-included with the normals swapped like this in the solving.txt
Problem fixed 🙂
Is it a bug or something I'm doing wrong?
Attachments
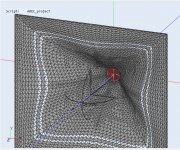
This is very strange and I don't have an explanation. All the slices are meshed exactly the same way so I have no idea how two of them could be reversed. I have never encountered this problem.
But I have a different hint. I noticed many times that with the new meshing algorithm (>= v4.5) the last slice at the egde of the mouth is very thin - this is genrally not a good thing. It should help to add the following line into the script:
Mesh.ZMapPoints = 0.5,0.1,0.5,0.98
You can decrese the last number (0.98) even a bit more, depending on how the last few slices will be meshes.
I suppose that narrow spikes in the frequency responses are related to so-called Non-uniqueness problem(NUC). If these narrow spikes occur I just ignore them.
It is well described in P.M. Juhl PhD thesis (chapter 5).
http://www.openbem.dk/docs/PMJ_Thesis.pdf
It is well described in P.M. Juhl PhD thesis (chapter 5).
http://www.openbem.dk/docs/PMJ_Thesis.pdf
The non-uniqueness problem is a purely mathematical problem, inherent in the surface Helmholtz integral equation (equation (2.26) with P on the surface S), and was originally pointed out by Lamb [58, p.500]. Hence, the problem is not connected to any particular numerical implementation, but occurs regardless of the choice of e.g. shape functions. It was shown by Schenck, that the characteristics frequencies for a given exterior radiation problem (i.e. an exterior Neumann boundary value problem) are the eigenfrequencies of the related interior problem with the same body shape, when the pressure is required to be zero on the inner side of the surface S (i.e. an interior Dirichlet problem). For this reason the characteristic frequencies are also termed fictitious eigenfrequencies
Thanks for the tip 🙂
Sometimes it is one band other times between 2 and four, the solution is easy enough, just a copy and paste and change a couple of numbers, just wondered if it was just me 😉
Sometimes it is one band other times between 2 and four, the solution is easy enough, just a copy and paste and change a couple of numbers, just wondered if it was just me 😉
I wonder if having a greater variation in the mesh makes a difference here?
Some meshes have quite a high variation from low to high even if the mean comes back to the 0.5 that the ABEC help says represents a good mesh
This is from the sim above
Some meshes have quite a high variation from low to high even if the mean comes back to the 0.5 that the ABEC help says represents a good mesh
This is from the sim above
Free Term calculation
Subdomain ElType Min Max Mean StdDev/1000
1 Interior 0.342 0.716 0.500 0.292
2 Exterior 0.480 0.515 0.500 0.003
BTW, I'd say you have unnecessarily too high number of slices in this case.
Could you post some of the scripts for which it occurs?
Could you post some of the scripts for which it occurs?
Soon we will see how much is that really necessary - I'm implementing the free-standing option. I hope that for the bigger waveguides it is not, because it's ugly 🙂
True, it's got the looks of sanitary ware, or an inflated inner tube.
If the mouth is large enough, a roundover should not be necessary.
Yes you are right, that one had 40 when I checked.BTW, I'd say you have unnecessarily too high number of slices in this case.
Script attached for the one shown or some slight variationCould you post some of the scripts for which it occurs?
Attachments
I suppose that narrow spikes in the frequency responses are related to so-called Non-uniqueness problem(NUC). If these narrow spikes occur I just ignore them.
It is well described in P.M. Juhl PhD thesis (chapter 5).
http://www.openbem.dk/docs/PMJ_Thesis.pdf
That seems a likely explanation, Dimitrij.
NUC is mentioned in a lot of horn-related research literature, including the thesis of M. Makarski.
Last edited:
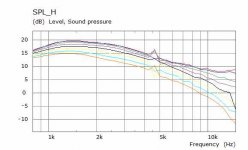
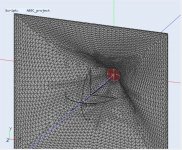
Problem area looks better when range limited between 4k and 7k with 36 frequenciesI bet on a "solution anomaly" as David mentioned. I can't imagine this could be real issue - it is so localized that I think this is not even possible. I would try to run it again limited to the range 4 - 5.5 kHz, with as many points as feasible (20 should suffice).
Now the weirdness shows up vertically when it was horizontal before
Attachments
Last edited:
- Home
- Loudspeakers
- Multi-Way
- Acoustic Horn Design – The Easy Way (Ath4)