Can you probe the DM output on the scope so we can see what it looks like? IE whether it is H2 or H3 would be a big clue.
Voila!
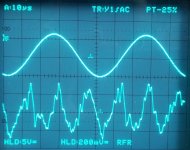
2 Osci screen shots THD20k@200W@8R with and without 80kHz filter.
Signal CH1 taken from DM output - 4Vrms is 40Vrms real output voltage.
Signal CH2 is taken from monitor output of VP-7723D.
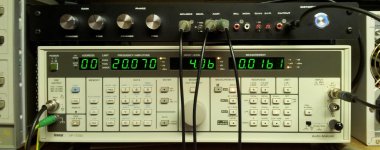
1 screen shot from THD analyzer setup: VP-7723D combined with Distortion Magnifier (by Bob Cordell).
Think mostly H2 - or am I wrong?
BR, Toni
Attachments

What a superb result from your new test equipment and from your amp.
0.00152 actual, is ~6dB worse than the 0.00068 simulation prediction.
0.00152 actual, is ~6dB worse than the 0.00068 simulation prediction.
I see mostly compressive H3. This is because at the output peaks the residual is always dragging it down.
It seems H2 is a lot lower than H3. Does this agree with simulation?
Can you check harmonic levels of the residual with a spectrum analyzer (if you have one) or a soundcard?
It seems H2 is a lot lower than H3. Does this agree with simulation?
Can you check harmonic levels of the residual with a spectrum analyzer (if you have one) or a soundcard?
I see mostly compressive H3. This is because at the output peaks the residual is always dragging it down.
It seems H2 is a lot lower than H3. Does this agree with simulation?
Can you check harmonic levels of the residual with a spectrum analyzer (if you have one) or a soundcard?
Using DM monitor output and spectrum analyzer HP-3585A H2 is 93dB and H3 is 91dB below fundamental at 20k@200W8R. Is 2dB a lot lower?
On correctly interpreting waveform of residual a la "mostly compressive H3": is there any literature online available? Maybe you know a link or some other source ...
BR, Toni
Last edited:
...
Can you check harmonic levels of the residual with a spectrum analyzer (if you have one) or a soundcard?
BTW: 20kHz and checking harmonics H2 and H3 with a soundcard...
Does this give any usable result?
Astx, you don't need to read about it. Just use the simulator and put a bunch of sine sources in series. The first one is the fundamental, the rest are harmonics. This way to can look at the residual and each harmonic individually. Then you will come to understand how they add up.
Admittedly, I haven't done this recently, and I haven't done it enough to get any skill, evidently. But I CAN tell H3 is one of the biggest contenders.
2db is definitely not a lot.
Admittedly, I haven't done this recently, and I haven't done it enough to get any skill, evidently. But I CAN tell H3 is one of the biggest contenders.
2db is definitely not a lot.
This is the idea. Once you've found the correct Rq for each transistor, you use those values for the .model stepping.
Looks weird - are we here using a bug of LTSpice? 😉
BTW: 20kHz and checking harmonics H2 and H3 with a soundcard...
Does this give any usable result?
Doesn't the DM/DA magnify the residual so it could be recorded with a soundcard? If your soundcard has -80db THD, then if you are recording a residual the recording will only be -80db off from the input. And even -20db distortion would be low enough to make sense out of a residual.
Astx, you don't need to read about it. Just use the simulator and put a bunch of sine sources in series. The first one is the fundamental, the rest are harmonics. This way to can look at the residual and each harmonic individually. Then you will come to understand how they add up.
Admittedly, I haven't done this recently, and I haven't done it enough to get any skill, evidently. But I CAN tell H3 is one of the biggest contenders.
2db is definitely not a lot.
Simulating multiple sine mixed is a really simply and good #1 learning tip! 🙂
Doesn't the DM/DA magnify the residual so it could be recorded with a soundcard? If your soundcard has -80db THD, then if you are recording a residual the recording will only be -80db off from the input. And even -20db distortion would be low enough to make sense out of a residual.
I will give it a try with 96khz sampling rate...
Then we will see if there is a 22kHz filter at sound card input.
This is quite fun but I must go to bed. The fun will continue in 8 hours (or my part in it anyways)!
I don't know what FFT software you have, but I use Baudline because I'm on Linux. It's pretty effective and supports averaging. If your software isn't very detailed you could send the recordings to me and I could run them through Baudline. Not that I'm an expert at FFT stuff.
I don't know what FFT software you have, but I use Baudline because I'm on Linux. It's pretty effective and supports averaging. If your software isn't very detailed you could send the recordings to me and I could run them through Baudline. Not that I'm an expert at FFT stuff.
Here too using mostly linux - and baudline is well known.
But also running ARTA/STEPS under WXP with a 192kHz asus xonar sound card.
Made a small mistake in my previous post:
With 96kHz sampling rate we are able to see only H2 of 20kHz as 48kHz is maximum resolution. 192kHz sampling rate (max. 96kHz resolution) is needed to be able to see H3 of 20kHz.
(The sound card must not filter analog input above 22kHz...)
Btw: my old analog spectrum analyzer HP3583A would top the best soundcard - it is able to scan the frequency spectrum from 20Hz up to 40MHz with a resolution of 100dB.
What a superb result from your new test equipment and from your amp.
0.00152 actual, is ~6dB worse than the 0.00068 simulation prediction.
Thank you and all others who helped getting this amp to this level.
Starting from post #1 with THD20k@200W@8R 0.004% now we have with small changes reached a level of 0.0015%.
Last edited:
And we have improved SPICE models for some important devices and better understanding of TMC & 'pure Cherry' too.Starting from post #1 with THD20k@200W@8R 0.004% now we have with small changes reached a level of 0.0015%.
Thank You, Toni.
Distortion comparison for short/long ribbon cable
THD21k@200W@8R using distortion magnifier and VP-7723D:
Input/VAS stage connected to output stage via
short ribbon cable 2 inch:
Using a long ribbon cable gives us:
THD21k@200W@8R using distortion magnifier and VP-7723D:
Input/VAS stage connected to output stage via
short ribbon cable 2 inch:
0.00154 % (bw. 80kHz)
0.00192 % (no bw. limit)
long ribbon cable 10 inch:0.00192 % (no bw. limit)
0.00157 % (bw. 80kHz)
0.00194 % (no bw. limit)
... not really a big difference.0.00194 % (no bw. limit)
Using a long ribbon cable gives us:
- more design freedom to put the input/vas stage nearer to the input jacks
- keep it far away from strong currents.
- modularity: for later upgrades you can simply replace the input/vas frontend if you e.g. want to use jfet in input stage or a symmetric input/vas
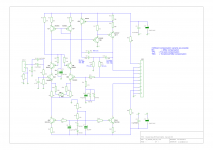
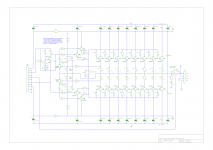
Revision 2.0 RC1 schematics ...
Version updated to revision 2.0-RC1:
Attached updated simulation files and schematics for current release candidate.
BR, Toni
Version updated to revision 2.0-RC1:
Attached updated simulation files and schematics for current release candidate.
BR, Toni
Attachments
-
sa2013_output_schematic_rev2_rc1.pdf27.8 KB · Views: 401
-
sa2013_input_vas_schematic_rev2_rc1.pdf16.6 KB · Views: 446
-
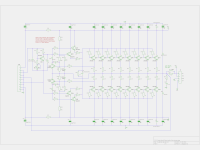 sa2013_output_schematic_rev2_rc1.png203.1 KB · Views: 1,209
 -
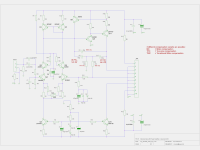 sa2013_input_vas_schematic_rev2_rc1.png235.4 KB · Views: 1,266
 -
2stageEF_class_AB_power_amplifier_rev2_rc1.zip10.7 KB · Views: 384
I get annoyed when a schematic is so large you can't make it out when it's shrunk to screen size but when you expand it you can only view 4 transistors at once.
I get annoyed when a schematic is so large you can't make it out when it's shrunk to screen size but when you expand it you can only view 4 transistors at once.
you are right. Using open source has it's limits too. For this reason I have attached PDF's. I am using "gschem" (from gEDA project) as schematics editor and this program has limited picture output features...
I get annoyed when a schematic is so large you can't make it out when it's shrunk to screen size but when you expand it you can only view 4 transistors at once.
better now?
Attachments
- Home
- Amplifiers
- Solid State
- 2stageEF high performance class AB power amp / 200W8R / 400W4R