Where do you get the -8dBFS on my post #2114? As I have repeatedly explained the level I used on REW was -3dBFS which is the highest possible before clipping starts. So in my understanding the level I used was same as Hans Polak used.I made an overview of the distortion measurements, see the attachment.
The higher even harmonics of OPA1632 output stage were probably due to the unoptimal setup as even harmonics usually tend to cancel well with OPA1632 in differential mode.The only two cases where the 10 kHz distortion dropped substantially were a case where the op-amps of the second stage were replaced with an OPA1632 (and the feedback network of the second stage was different) and a case where the common-mode biasing was disturbed such that the second stage was forced to work in class A.
From the graph. The spectral peaks of the two desired tones look like -8 dBFS each on the graph.Where do you get the -8dBFS on my post #2114? As I have repeatedly explained the level I used on REW was -3dBFS which is the highest possible before clipping starts. So in my understanding the level I used was same as Hans Polak used.
They can't be -3 dBFS each, because then the peak value of their sum would be about +3 dBFS. Or does that -3 dBFS refer to the RMS value of the sum of the two tones, expressed with respect to the RMS value of a single full-scale sine wave?
How? Please note that ADC full scale is not the same as DAC full scale. What is shown in the RTA graph is ADC level compared to full scale.The spectral peaks of the two desired tones look like -8 dBFS each on the graph.
Yes. In REW you only set the sum of the two tones.Or does that -3 dBFS refer to the RMS value of the sum of the two tones, expressed with respect to the RMS value of a single full-scale sine wave?
I have the following to comment on the figures.
In Arta's manual I can find:
second order IMD in percent is: 100* I(f2-f1)/I(f1+f2)
third order IMD in percent is: 100* I(2f1-f2)+ I(2f2-f1)/I(f1+f2)
In my IMD measurement:
I(f2-f1) = -119.27dB or 1.08768e-6
I(2f2-f1) = -109.43dB or 3.37676e-6
I(2f1-f2) = -119.27dB 0r 1.08768e-6
Rms level according to Arta was -3.5dBrms, so both f1 and f2 are at -6.5dB.
I(f1+f2) = Power(10;-3.5/20) = 0,668344
Applying the above figures gives:
IMD second order at 0,00016% or -115,8dB (Arta mentions 0,00026% ??)
IMD third order at 0,00067% or at -103,5dB (Arta mentions 0,00091% ??)
Now doing the same calculculation for Bohrok's spectrum:
I(f2-f1)=-140dB or 1.0e-7
I(2f2-f1)= -114dB or 1.99526e-6
I(2f1-f2) = -116dB or 1.58489e-6
Peak level to graph -1.97dB and Rms level at -4,97dB, so both f1 and f2 are at (-1,97-6.02) = -7.99dB.
I(f1+f2) = Power(10,-4,97/20) = 0.564287
Again applying these figures the same way as above:
IMD second order at 0,000018% or -135.0dB
IMD third order at 0,00063% or -103.9dB
I may have done something that may cause the difference between Arta's and mine calculation, roughly a sqrt(2) but by using the same calculation, Bohrok's figures and mine are 1:1 comparable.
What can be seen is that both our third order IMD with resp. -103.5 and -103.9 are within 0.4dB !!
However Bohrok's second order IMD is 19.2dB below mine with -135,0dB versus -115.8dB.
This could well be caused by my Lynx A/D converter having a specified dynamic range of 117dB.
Hans
Just as further confirmation on my 10kHz sine measurement in post #2080 the DAC level was -1dBFS which means that DAC full scale is at about -2dBFS in ADC. In my CCIF IMD measurement in post #2114 the peak samples are at -1.97dBFS which means that DAC peak level was at full scale.

Bohrok,
It doesn’t matter that much what your graph is telling in absolute sense, its all about relative figures.
Hans
It doesn’t matter that much what your graph is telling in absolute sense, its all about relative figures.
Hans
Yes. As our IMD results are quite close it confirms that there is nothing significantly different in my board and Marcel's board which also means that Marcel's board likely has similar 10kHz distortion as mine.
Please note that ADC full scale is not the same as DAC full scale. What is shown in the RTA graph is ADC level compared to full scale.
Yes. In REW you only set the sum of the two tones.
I see. Then I'll change it from -8 dBFS to -6.02 dBFS per tone.
However Bohrok's second order IMD is 19.2dB below mine with -135,0dB versus -115.8dB.
This could well be caused by my Lynx A/D converter having a specified dynamic range of 117dB.
That doesn't sound strange to me. Second-order intermodulation of a balanced circuit normally spreads all over the place because it depends on mismatch, and we already know that bohrok2610 matches his passive components.
Than you will have to correct the IMD products in the graph by the same +1.98dB, with the result that IMD doesn't change.
Hans
Hans
f1 + f2 is the frequency of the second-order sum intermodulation product, why would anyone normalize the intermodulation products to that?second order IMD in percent is: 100* I(f2-f1)/I(f1+f2)
third order IMD in percent is: 100* I(2f1-f2)+ I(2f2-f1)/I(f1+f2)
Than you will have to correct the IMD products in the graph by the same +1.98dB, with the result that IMD doesn't change.
Hans
If bohrok2610 had measured at a 2 dB lower level, the third-order intermodulation products would have been 6 dB lower and the distance to the wanted tone 4 dB larger.
In my IMD measurement:
I(f2-f1) = -119.27dB or 1.08768e-6
I(2f2-f1) = -109.43dB or 3.37676e-6
I(2f1-f2) = -119.27dB 0r 1.08768e-6
Rms level according to Arta was -3.5dBrms, so both f1 and f2 are at -6.5dB.
It's strange that the two third-order intermodulation products have such a large difference, almost 10 dB, despite their small frequency ratio. They are -102.93 dB and -112.77 dB with respect to the desired tones. (As an RF designer, I always refer the intermodulation products to the level of one of the tones, apparently different from the ARTA convention.)
I(2f2-f1)= -114dB or 1.99526e-6
I(2f1-f2) = -116dB or 1.58489e-6
Peak level to graph -1.97dB and Rms level at -4,97dB, so both f1 and f2 are at (-1,97-6.02) = -7.99dB.
Here it is only 2 dB: about -106.01 dB and -108.01 dB with respect to the desired tones.
Anyway, my conclusion is still that the distortion is small in all cases and that the two cases with a substantially reduced distortion both changed something in the second stage: either forcing the second-stage op-amps into class A or replacing them with something else.
I simply repeat how Arta describes their algorithm.f1 + f2 is the frequency of the second-order sum intermodulation product, why would anyone normalize the intermodulation products to that?
I(f1+f2) in that respect means de rms of the sum of both signals.
When both are at -6.5dB rms, their rms sum is -3.5dB.
And when I(f2-f1) is the rms value of the second order product, in my graph -119.27dB the second order IMD is I(f2-f1)/I(f1+f2) = (-119,27dB) - (-3.5dB)= -115.77dB.
So of course with the -3.5dB, the second order product has to be be normalized.
Hans
Last edited:
Sorry, I can't change the official definitionIt's strange that the two third-order intermodulation products have such a large difference, almost 10 dB, despite their small frequency ratio. They are -102.93 dB and -112.77 dB with respect to the desired tones. (As an RF designer, I always refer the intermodulation products to the level of one of the tones, apparently different from the ARTA convention.)
Here it is only 2 dB: about -106.01 dB and -108.01 dB with respect to the desired tones.
For amplifier distortion measurements, when f2 close to f1, the standard IEC 60268 – 3 defines two factors:
2nd order Difference frequency distortion factor DFD2 = 100* I(f2-f1)/I(f1+f2) %
3rd order IMD in percent is: DFD3 = 100* (I(2f1-f2)+ I(2f2-f1))/I(f1+f2) %
And why Arta is showing large differences between the first two 3rd order products is out of my control.
Arta is not exactly known as an unreliable piece of software.
Hans
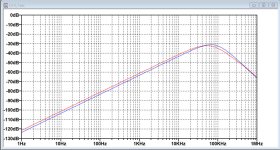
While still not excluding the possibility that the perceived sound improves when disabling the CM servo for audio frequencies, I came to a surprising result while simulating the sensitivity for the components accuracy.
Varying the tolerance for each component showed totally different effects on CMRR, so it is just not possible to tune one of the two 2K servo resistors to optimize CMRR.
I gave all resistors on the upper differential side of the first stage including the compound 376.25R Firdac resistor a 0.2% tolerance and 2% for the two caps. The lower differential side was unaffected by changes in tolerance.
Now I measured CMRR at the differential output of the first stage with
1) the original servo components 2*2K and 15pF and
2) with 2*1Meg and 10uF.
The attached curve in red is for the 2*2K+15pF and the blue curve for 2*1Meg+10uF.
To my big surprise the servo disabled for audio has an even better CMRR as the original one.
This was just one attempt and with tolerances even closer as in Marcel's circuit diagram !!
So I tend to believe the possibility that perceived sound can improve when using the servo only for DC restore purpose and not for CMRR.
Hans
Attachments
- Home
- Source & Line
- Digital Line Level
- Return-to-zero shift register FIRDAC