Did you run those simulations using 1M ohm loads? If so, maybe try running them into 100k ohms or even 50k ohms. That's more like a real world load. Perhaps also put 500pF or 1nF from out to ground to simulate a long cable run of not-so-great interconnects.
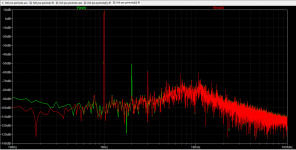
Now .options plotwinsize=0, both H3 is below H2, what happened here? So now the difference (almost 30db) is in H2 only?
Attachments

Last edited:
I'm afraid I don't understand what exactly LTspice is doing when it creates the FFT and THD readings.
I use the following SPICE directive for the simulation, and take the FFT from that:
It would be very surprising if a triode stage, even with NFB, made more H3 than H2 at small signal levels.
I use the following SPICE directive for the simulation, and take the FFT from that:
Code:
.options plotwinsize=0
.tran 0 100m 60m 1u
.four 1k 10 v(output)
.OPTIONS numdgt=8
.option noopiter
It would be very surprising if a triode stage, even with NFB, made more H3 than H2 at small signal levels.
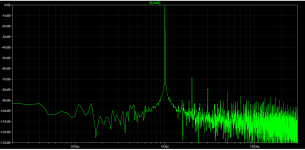
Some of options are causing the FFT plot to slop a lot, so best to not including them. With the same rules applied to both modes, triode FFT mode appears more deviated from original (Salas's), and as it has less H2 to start with, apply more fb brings it down further (according to normal logic).
Run your sim on the original Salas circuit into a 100k load and see how accurate. I measured my actual circuit, we can compare
Real life version
some of the spurious stuff below -105 could be the analyzer. That’s about at its resolution.
some of the spurious stuff below -105 could be the analyzer. That’s about at its resolution.
Attachments
Last edited:
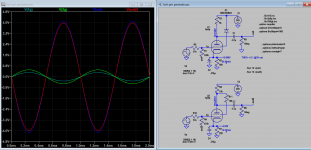
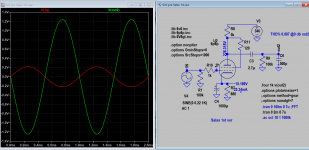
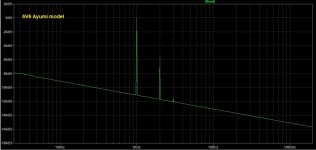
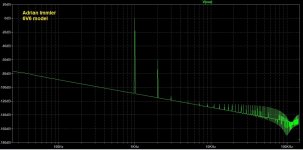
Here's the circuit from post #1 simulated in LTspice with the directive I've been using. One graph is the FFT using an Ayumi N. 6V6 model, the other is using Adrian Immler's model.
THD at 1V rms out into 100k ohm load:
AN model: 0.126% (-58dB)
AI model: 0.085%
Those predictions look a bit rosier than what happens in real life. The real thing looks like it makes H2 at -53dB down. which would be about 0.15% THD, I think. (How does one calculate that...?)
Koonw, I couldn't get your 6V6 model to run, Strange, because there were no error messages.
EDIT TO ADD:
I attached the .asc as well.
Attachments
Last edited:
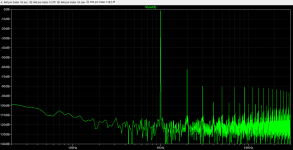
I post the entire asc. You use .options plotwinsize=0, I use .options plotwinsize=1
Attachments
Last edited:
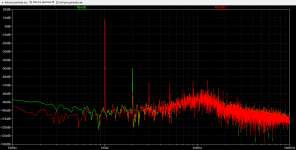
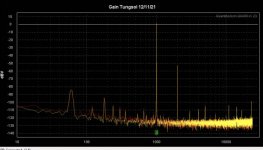
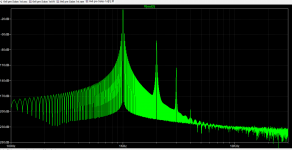
I dug up three charts from the original gain version preamp. Took them in 2007-2008! Not a today's performance measurement rig and wrong Y scale (SPL) but you get the numbers.Real life version
some of the spurious stuff below -105 could be the analyzer. That’s about at its resolution.
Attachments
Thanks Salas.
Any idea what the output signal voltage would have been at half volume?
I usually quote fantastical SPICE predictions using 1V rms output as the reference point.
Any idea what the output signal voltage would have been at half volume?
I usually quote fantastical SPICE predictions using 1V rms output as the reference point.
You use .options plotwinsize=0, I use .options plotwinsize=1
Thanks Koonw.
What does the 'plotwinsize' argument do? Any idea?
From a quick search, I found this, where I saw this:
the .options statment sets plotwinsize = 0 which disables compression and numdgt is used to set significant figures used for output data. If numdgt > 6, double precision is used.
That FFT was obviously set up for measuring speakers at the time hence the octave smoothing and SPL scale. As far as I can remember I was normally using 1V RMS for full DUT output because the common man's audio cards of old would quickly build up own harmonics around 1.5V and fully saturate at 2V.Thanks Salas.
Any idea what the output signal voltage would have been at half volume?
I usually quote fantastical SPICE predictions using 1V rms output as the reference point.
Half volume pot must have been the physical knob's mid position. As we see something like -16dB difference between full and half in the charts, that gives 150mV RMS. In other words -1dB below unity (In=Out test signal level) on the pot when we consider the preamp's 15dB gain. One O'clock should have been unity when "half_vol" chart was 12 O'clock.

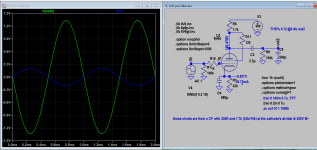
I settle for these settings, it's about as much details one can hope to see, with Bohman Windows.
Code:
.tran 0 {simtime} {dlytime} {timestep}
.options plotwinsize=0
.options method=gear
.options numdgt=7
.param numcyc=150
.param dlycyc=1
.param FFT=18
.param simtime=numcyc/Freq+dlytime
.param dlytime=dlycyc/Freq
.param timestep=(simtime-dlytime)/2**FFT
.four {Freq}  V(out)
.param Freq=1k
Attachments
- Home
- Amplifiers
- Tubes / Valves
- 6V6 line preamp