Flat frequency response = flat phase response = flat group delay. It's as simple as that. Non-flat FR = non-flat phase = non-flat GD. All in 1:1 mapping. From any one of these you can always directly calculate the other two. And if any of those is the same, the other two will be the same as well. That's about all about group delay....
(Speaking about a horn+CD alone.)
(Speaking about a horn+CD alone.)
Last edited:
For a device like a horn or CD, that's what always happens. It takes additional filtering/summing via crossover to achieve what you suggest.
Otherwise it's not possible. That's why we talk about minimum-phase systems, for which flat amplitude response implies flat all the rest (and vice versa). That's why we say it's really the same thing.
Otherwise it's not possible. That's why we talk about minimum-phase systems, for which flat amplitude response implies flat all the rest (and vice versa). That's why we say it's really the same thing.
Last edited:
The start up transient. How would you relate this to phase? Or should I say, what effect on phase does this have?
Well that all emerge from a convolution of the input signal with the impulse response. Different frequencies can be delayed differently. What more would you like to know?
Thats not the question I asked...heres a better one...
When the start up transient changes...does the phase have to go up or down? That is...can I have 2 reproduced signals, same frequency, 100% in phase, with unique start up transients?
When the start up transient changes...does the phase have to go up or down? That is...can I have 2 reproduced signals, same frequency, 100% in phase, with unique start up transients?
If the system changes a transient, then it simply doesn't have a flat FR, nor amplitude, nor phase.
Well now you have done what I have seen neglected in the past by some...To include amplitude as its own domain.
Clarity...
Clarity...
Frequency and time are the two different domains. Amplitude and phase response are always related so that you can calculate one from the other. (Again, speaking about a MP system, which a horn is an example of.)
Waveform shape is simply the time response (as can be calculated from the frequency response).
Waveform shape is simply the time response (as can be calculated from the frequency response).
Last edited:
Amplitude and phase are always related so that you can calculate one from the other
Now that, is a wow moment for me. I was certain that they were separate. I guess looking at a reference signal, any other version of it, with the same frequency, would be "out of phase? In other words phase accounts for not just the X axis of the graph but the Y was well? If we change only amplitude but leave frequency alone and put them "in phase on the x axis" they will be in sync on the X axis.
If thats the answer, I'm down.
Normally when I think "out of phase" I think of cancellations ...in this form of "out of phase" there is no cancellation
Attachments
Last edited:
Visualization of what I am describing. This....is out of phase...is what you are suggesting. Jumping back to group delay....there is a change in amplitude involved.
..Amplitude and phase response are always related so that you can calculate one from the other..
Attachments
Last edited:
I really don't get what you are trying to show Camplo.
From what i'm gather from your last message it seems to me you forget one thing in your approach: we are not dealing with devices which have infinite bandpass ( don't even know if it is relevant as i don't get what you are trying to say! 😉 ).
From what i'm gather from your last message it seems to me you forget one thing in your approach: we are not dealing with devices which have infinite bandpass ( don't even know if it is relevant as i don't get what you are trying to say! 😉 ).
You're looking at it too simply. when you have transients, you've generated frequencies across the whole spectrum. each frequency has its own phase and amplitude, this gives rise to the 'complex' looking amplitude pattern that you pointed out in your test signal.
look honestly you should REALLY read an engineering book on the mathematics of signals, fourier transforms etc. All of this stuff is really covered in 1st year of engineering really well, could easily look up a youtube lecture series
look honestly you should REALLY read an engineering book on the mathematics of signals, fourier transforms etc. All of this stuff is really covered in 1st year of engineering really well, could easily look up a youtube lecture series
An impulse response produces a transfer function matrix of complex numbers. The absolute (or modulus) of those numbers gives the magnitude response, and the four-quadrant inverse tangent of the numbers gives the phase angle.
If you know the sampling rate, you can technically 'reconstruct' the phase data from a magnitude response. The issue is that becomes very difficult if a window has been applied, especially a frequency-dependent one.
Likewise, you can 'adjust' the response of a transfer function to represent a scale model in either direction by simply changing the sampling rate accordingly. Of course, that means measuring at 192 kHz if you want to keep a good number of points-per-octave after the transform.
For the owner of one of the longest horn-related threads I've seen on here, may I ask if you bought a copy of Kolbrek & Dunker's excellent book? If not, it's about to be reprinted - this week, according to my library - so put it on the wish list. It's huge, well written, and has a bunch of sections on group delay...
Data without context is often more dangerous than no data at all, and I don’t want to be perpetrating copyright infringement, but here are some choice charts from pages 807-808, which covers the audibility of group delay and the implications for horns:


The discussions on your theories or suggestions might go more smoothly - and you'd be able to investigate better yourself - if you did the background reading. Even without library access to papers, this book covers more or less everything at an overview or better level.
If you know the sampling rate, you can technically 'reconstruct' the phase data from a magnitude response. The issue is that becomes very difficult if a window has been applied, especially a frequency-dependent one.
Likewise, you can 'adjust' the response of a transfer function to represent a scale model in either direction by simply changing the sampling rate accordingly. Of course, that means measuring at 192 kHz if you want to keep a good number of points-per-octave after the transform.
For the owner of one of the longest horn-related threads I've seen on here, may I ask if you bought a copy of Kolbrek & Dunker's excellent book? If not, it's about to be reprinted - this week, according to my library - so put it on the wish list. It's huge, well written, and has a bunch of sections on group delay...
Data without context is often more dangerous than no data at all, and I don’t want to be perpetrating copyright infringement, but here are some choice charts from pages 807-808, which covers the audibility of group delay and the implications for horns:
The discussions on your theories or suggestions might go more smoothly - and you'd be able to investigate better yourself - if you did the background reading. Even without library access to papers, this book covers more or less everything at an overview or better level.
Still, what's the point of studying group delay of horns as standalone devices? It just doesn't make any sense to me.
^ to me neither.
It,s part of a whole system and like many things te global results are often the sum of added parts plus something else.
Camplo, take a step back, escape from rabbit hole you dig for the moment, nothing will stop you to go back at it later if you need it to.
It,s part of a whole system and like many things te global results are often the sum of added parts plus something else.
Camplo, take a step back, escape from rabbit hole you dig for the moment, nothing will stop you to go back at it later if you need it to.
Still, what's the point of studying group delay of horns as standalone devices? It just doesn't make any sense to me.
Well, complementary absolute group delay curves can make system integration easier. Whether that’s matching a driver to a horn, or a complete horn speaker to a sub, or another type of design.
If you know the contribution of each element, you can predict the resulting group delay curve. But I’d only consider it worthwhile in terms of keeping it below the audible threshold since the contribution of other factors or elements in the signal chain will cause a further shift towards a noticeable level of overall group delay.
There are, of course, far bigger issues to tackle first. Consistent dispersion, high-order modes, non-linear distortion at higher drive levels, ease of build, etc.
The book covers this and a lot more in good detail 🙂 I was more suggesting that Camplo would benefit from having a copy in general, than for this specific 'issue'
As many have already mentioned, today you can eliminate any group delay with a DSP within a minute, if you like to do so...
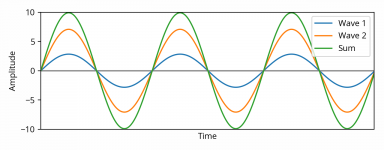
Visualization of what I am describing. This....is out of phase...is what you are suggesting. Jumping back to group delay....there is a change in amplitude involved.

That is a graph of two sine waves and their summation.
The two sine waves have the same frequency, but different amplitudes. They are completely in phase with each other, and simply sum to a greater amplitude.
There is nothing in that graph remotely about different phase or group delay ....
Camplo, like everyone keeps saying you REALLY need to learn some basic signal and measurement terminology, concepts, and math.
The REW manual is a tremendous resource, as is ARTA's for a further, more mathematical (often over my head) dive into it.
I highly recommend the Smaart Version 8 manual, as it is written for prosound processionals often with immense real-world experience, who are needing a introductory course that also goes deep. .
Another super source on signal and measurement is SynAudCon. Many free articles can be found on the prosoundtraining.com site.
Ps, thx for your gracious response to my humor..
- Home
- Loudspeakers
- Multi-Way
- Is it possible to cover the whole spectrum, high SPL, low distortion with a 2-way?