I still can't see what it has to do with size.
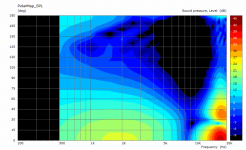
I kind of wonder as well. But my own tests of horns about that depth or smaller does show some limitation. So I am curious, because I have not seen satisfying CSD performance. The analysis of the frequency response usually is quite close. But the CSD is just not on par with what I am used to. Although I could probably use dsp processing to get the better performance, but I was hoping to use it just for icing on a cake.
Just recently I got a pair of old Behringer B300 speakers to study this a bit more.
Isn't "honk" just mouth reflection, or some other discontinuity of the horn wall shape caused reflection? Then it is matter of smooth shape and mouth termination if there is reflections or not isn't it? Reflections happen due to bad profile not due to depth.
Is there a frequency band which has been named "the honk"? In that case the depth is part of the equation, deeper device has mouth reflections happening lower in frequency?
Is there a frequency band which has been named "the honk"? In that case the depth is part of the equation, deeper device has mouth reflections happening lower in frequency?
I don't know what "horn honk" actually is, I only know that there are horns/waveguides that don't produce any subjectively noticeable sound artefacts, which I could call something like that. So to me this is actually not that interesting anymore - we already know how to make transparent-sounding waveguides, I don't need to know more. If someone would figure this out, great, if not, who cares what "horn honk" really was. It's the past anyway. 🙂
- I was thinking once again about the input wavefront shape (i.e. the higher duct mode(s) at the exit of a compression driver), its measurement and subsequent usage.
Perhaps the following could be done: I would create a freely available waveguide model - something smallish that everyone could download and (let it) print on a 3D printer. Then from a prescribed set of SPL measurements on this waveguide a specialized program would calculate the coefficients of the modes, i.e. the "shape" of the wavefront for a particular driver used (it would have the knowledge of the simulation results of what each mode does on that particular waveguide). This way, if there was enough interest, quite a large database of various drivers could be collected.
The question is, however: would this be of any use in the end? Are we able to design a waveguide utilizing the knowledge of an actual input wavefront to make even better results? I can't imagine how would I do that. Some crazy optimization?
Last edited:
I'm wary of collecting a "database" of measurements (from which comparisons would be made) from multiple sources. Too many variables at play there, and it's too easy for differences in experience, equipment, etc to influence the data.
I think this is the most important question here. I can imagine one way in which this could be incorporated into an Ath simulation/optimization routine:
Step 1 seems the hardest part right now, but perhaps a plane wave tube could solve that?
EDIT: re-reading your post, it seems we might be describing the same process. Hah. My first point still stands, however.
The question is, however: would this be of any use in the end? Are we able to design a waveguide utilizing the knowledge of an actual input wavefront to make even better results? I can't imagine how would I do that. Some crazy optimization?
I think this is the most important question here. I can imagine one way in which this could be incorporated into an Ath simulation/optimization routine:
- Determine the prevalence of the first few wavefront modes for a given compression driver. Normalize them to generate scaling factors.
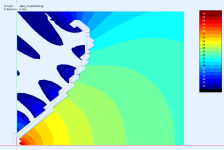
- Simulate the output of each mode in the waveguide using Ath, as you have shown.
- Perform a weighted sum of all (significant) modes to generate a more realistic simulation. Optimize this output.
Step 1 seems the hardest part right now, but perhaps a plane wave tube could solve that?
EDIT: re-reading your post, it seems we might be describing the same process. Hah. My first point still stands, however.
Last edited:
Simply stated, if we suppose the wavefront can be sufficiently measured using the method I described above (and it seems doable to me), how to utilize this knowledge further?
Last edited:
It seems to me that if you could determine the relative influence of each mode of the wavefront from a specific CD (by the process above), you could simulate each mode in Abec and generate a weighted sum of those simulations that very accurately predicts the performance of that CD. At that point you could optimize the waveguide based on that weighted sum model instead of the 0,0 mode alone.
Or in fewer words: you can generate a more accurate model of the CD (as a weighted sum of the first few modes) and use that model to optimize the waveguide.
It's a process that would have to be repeated with each CD of interest, but it could allow for more accurate predictions of waveguide performance.
But how would you optimize it? At least that seems the hardest part to me.... At that point you could optimize the waveguide based on that weighted sum model instead of the 0,0 mode alone.
- To have more accurate model is of no use if one doesn't know how to improve the results. That's what I meant. Do we know how to improve the results?
Last edited:
Are you asking about the process of optimizing the design to achieve a certain goal, or about what the goal should be in the first place?
How would you proceed if you had a wavefront model of a particular driver? How would your optimization look like? What exactly would you do? 🙂
Process or performance... or both?
How = process. Performance = dB, angels, % distorsion etc...
//
How = process. Performance = dB, angels, % distorsion etc...
//
The first question is: Would an "optimal" waveguide using "real" wavefront curvature differ from one that assumes flat? I'm not sure that it would and my guess would be that it would not.
The HOM are going to be small, almost irrelevant in a 1" driver and not very significant in a 2". How likely is it that optimizing a HOM would not degrade the normal mode? Given the ratios this would seem to me to be counter productive.
The main reason that I would want to know the wavefront curvature would be to optimize the driver - but none of us do that. A database of drivers might show the better ones, but I don't see how a waveguide could "optimize" the driver.
How would you proceed if you had a wavefront model of a particular driver? How would your optimization look like? What exactly would you do? 🙂
I'm suggesting that a true "wavefront model" isn't necessary in order to accurately predict performance. Instead, all you need to know are the relative intensities of the first 3 or 4 modes. This is based on the assumption that the wavefront exiting the CD is the same regardless of any waveguide/horn that comes after it (which, now that I say it, may not be true).
If that assumption is valid, however, then here's what I would do:
- Pick a CD and design an axisymmetric OS waveguide that fits it. 3D print it.
- Take anechoic measurements of my chosen CD with this waveguide. In parallel, I would simulate the first 3 modes of this waveguide using ABEC. At this point I could directly compare simulations with measurements.
- Perform a weighted sum of the 3 modal simulations. Adjust the scaling factor of each mode until the total sum matches the measured response of the CD/WG combo.
- For any future waveguide iterations, simulate the first 3 modes and sum them together using the scaling factors from above.
- Optimize my waveguide design by eye until the output matches my goal (ie. by trial and error, brute force, etc.).
- Print a prototype and validate the results.

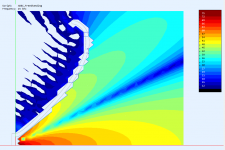
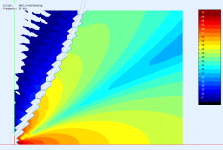
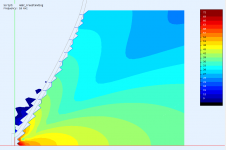
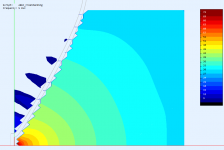
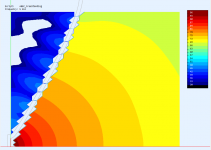
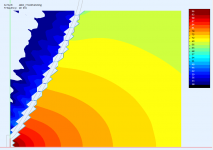
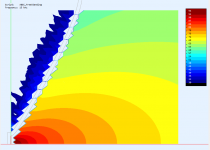
Could you post the same presentation for the flat source for comparison (either waveguide)? thanks!
Sure -
Attachments
Last edited:
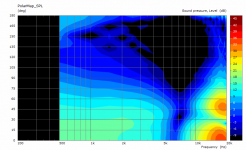
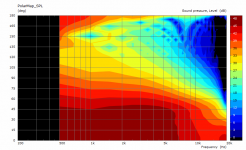
Made an observation comparing with data found on Test Bench: Celestion CDX1-1742 1” Exit Pro Sound Compression Driver | audioXpress and Test Bench: Oberton ND45 Pro Sound Compression Driver | audioXpress Both conveniently have some impedance wiggle at ~6kHz and ~15kHz as well as associated axis dips which looks like the 0,1 mode happen with real drivers and is visible in measurements. While this might be pure coincidence the net effect in these cases seem to be few decibels. Is this about the most we can see on todays drivers?
Another driver Test Bench: The 140FCD 1” Compression Driver from REDCATT | audioXpress doesn't seem to have such anomalies so one can choose a driver with less issues.
If you have mucho spare time you could try and simulate with source that has few db worth of 0,1 mode mixed in with the 0,0. Not sure if worth it unless doing it for fun 🙂
Last edited:
I couldn't help but notice that the source in all 3 cases looks pretty much flat.
Am I missing something?
Am I missing something?
It might not be quite the same but the 3.5K lump looks pretty obvious in the impedance and the polar 😉Another driver Test Bench: The 140FCD 1” Compression Driver from REDCATT | audioXpress doesn't seem to have such anomalies so one can choose a driver without "obvious issues".
- Home
- Loudspeakers
- Multi-Way
- Acoustic Horn Design – The Easy Way (Ath4)