@reddish75 I have also noticed the latency occurs way more after you start the computer. Since I started leaving my laptop on all the time, I haven't had it act up. I turn it off and on before I leave to make sure it stays updated. Some other people have identified through the latency monitor that their wifi is causing issues also, mine wasn't.
Latency is definitely worse when I startup also. With realtime priority, ASIO4ALL drivers, WIFI off and a good delay after booting my laptop (Windows 10) is pretty reliable now with 44.1k or 48k with REW. But that laptop just isn't usable at 96k or 192k. Also I have the battery fully charged and the CPU minimum speed set to maximum in the power management settings.
On my Windows Vista desktop I spent all sorts of time online learning about what can be not run at startup, disabled totally, rescheduled, etc. That machine can run REW much better than the laptop even though it is old. I think the higher CPU clock rate along with the PCI based audio interface help. I can't directly compare but I wonder if Windows 10 is worse than Vista for this.
On my Windows Vista desktop I spent all sorts of time online learning about what can be not run at startup, disabled totally, rescheduled, etc. That machine can run REW much better than the laptop even though it is old. I think the higher CPU clock rate along with the PCI based audio interface help. I can't directly compare but I wonder if Windows 10 is worse than Vista for this.
Might be, my laptop is running Windows 8.1. It works with all settings and very rarely hiccups now. I did shut everything down, removed items since this is a dedicated brewing and electronics laptop.
What buffer size in REW do you use? Can you test with the largest values for playback/capture?
I'll check this out tomorrow, in the meantime I've; reinstalled windows 10 from scratch, this is now fully updated. The only programs installed are Kaspersky and Rew latest beta running realtime priority. When measuring wifi is switched off and Kaspersky shut down. Battery is full and laptop on standby very rarely shut down.
I have been using ARTA, but wanted to try REW for distortion measurements. In general a positive experience, but I have one issue: I cant get rid of the averaging curve in the FFT window.. (I see two, one average and one 'live') I try to disable it. but it's still there.
Suggestions?
Suggestions?
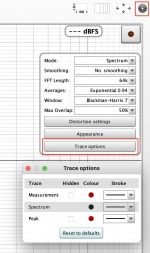
There are 3 traces on the RTA graph. The first is the currently selected measurement from the main REW window (the last measurement saved, typically), the second the 'live' RTA trace and the third the peaks of the live trace. Any of them can be removed from the graph by deselecting them in the graph legend.I have been using ARTA, but wanted to try REW for distortion measurements. In general a positive experience, but I have one issue: I cant get rid of the averaging curve in the FFT window.. (I see two, one average and one 'live') I try to disable it. but it's still there.
Suggestions?
[URL="https://www.diyaudio.com/forums/members/johnpm.html" said:JohnPM[/URL];]There are 3 traces on the RTA graph. The first is the currently selected measurement from the main REW window (the last measurement saved, typically), the second the 'live' RTA trace and the third the peaks of the live trace. Any of them can be removed from the graph by deselecting them in the graph legend.
If I use a 1kHz notch filter while measuring distortion can REW "calibrate" for the filter loss? I am thinking of doing this in an attempt to measure DIY PCM1794 and ESS9038 DAC performance. (Because my soundcard preamp, spurs and ADC limit my THD measurement capability.)
If not I guess I will just look at the distortion display in dB and manually calculate in a spreadsheet.
This is the sort of notch filter I plan to prototype on a piece of bare copper clad PCB: Quick and Simple Notch Filter for THD Measurements – Toli's DIY
So 50 to 60 dB loss at 1kHz, for example. Maybe 13 dB at 2kHz, etc.
You can certainly set up a calibration file with a notch filter in the loopback. I use that form of calibration to extend soundcard response down to 2Hz, and probe response up to 96kHz. You can manually adjust the auto prepared calibration file, and adjust how the calibration file is calculated - obviously the calibration values for a deep notch would get noisier and be influenced by frequency step resolution about a notch.
There are two features to help with measurements made using a notch filter.If I use a 1kHz notch filter while measuring distortion can REW "calibrate" for the filter loss?
- In the Distortion settings there is an option to manually enter the level of the fundamental rather than have REW determine it from the input.
- To correct for the notch you can measure the notch filter response and use that to generate a calibration file which REW will apply to correct the harmonic levels. To do that I would make a sweep measurement of a loopback firstly with the notch filter in place, then another without it, then use the Trace arithmetic feature of the All SPL graph to generate (notch response)/(no notch response) and export that result as a text file to be loaded as a mic cal file. Alternatively you could just measure the notch response, offset the measurement so that the dB values correctly reflect the notch filter loss at the harmonics (the fundamental isn't critical since Manual fundamental deals with that) and export that offset notch response as text and load it as the mic cal file.
Be aware that those notch filters (twin t) is drifting by time. So the calibration file is only valid for some minutes. It gets more stable after being powered on for a while, after one hour operation, then you have to adjust the notch during heating up.
What drift the most is the center frequency of the notch so if you manually enter the level of this, as suggested by John, the error will be minimal.
What are those peaks
Hi, I made some measurement on my F5Turbo.
1 kHz, 2,83V peak 8 ohm load and 8 ohm+1,5 uF parallel.
It seems to me OK, just the 100 Hz peak are too much or normal at a class A amp with CRC psu filtering?
Hi, I made some measurement on my F5Turbo.
1 kHz, 2,83V peak 8 ohm load and 8 ohm+1,5 uF parallel.
It seems to me OK, just the 100 Hz peak are too much or normal at a class A amp with CRC psu filtering?
Attachments
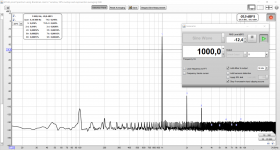

Looks like intermodulation with the 100Hz from the supply. That will generate multiple sum & differences with the 1kHz carrier. 1kHz +/-100, 1kHz +/- 2x 100, etc.
Jan
Jan
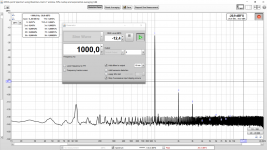
What are those peaks around 1 kHz?
I sometimes find that I get those peaks if I have a bad connection.
You guys might also like to check out my findings on my honey badger amplifier. Making distortion measurements.
I couldn't work out why I had so much distortion a 16khz. I haven't fully verified my results yet but it looks like its the load resistor. So if you have one like this you may want to subscribe to this thread.
diyAB Amp - The "Honey Badger"
diyAB Amp - The "Honey Badger"
I reduced the distortion from 0.23% to 0.0055% just by measuring prior to my zobel network indicator as apposed to across the load resistor.
Check out post 2419 onwards.

Last edited:
Thanks Jan!
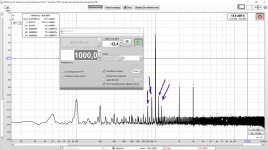
And there is a peak on 200 Hz too 🙁
The amplifier sounds rich and relaxed, very enjoyable.
And there is a peak on 200 Hz too 🙁
The amplifier sounds rich and relaxed, very enjoyable.
Perhaps set the generator to lock the frequency to FFT, and disable the dither, to see if that causes a noticeable difference.
50hz looks way to high to me. Does you circuit use a ground lift on the power supply or a small 4.7ohm resistors between the amplifier ground and the signal ground.
I always connect the ground of my distortion test lead to the signal ground not the negative speaker terminal. This cuts out alot of unwanted noise.
This also maybe of interest.
QA401 - Differential measurements with attenuation - QA401 - QuantAsylum Forum
I always connect the ground of my distortion test lead to the signal ground not the negative speaker terminal. This cuts out alot of unwanted noise.
This also maybe of interest.
QA401 - Differential measurements with attenuation - QA401 - QuantAsylum Forum
- Home
- Design & Build
- Software Tools
- How to - Distortion Measurements with REW