^P.S. I never emulate passive filter with active FIR. "Ready at once without listening a second" (as active or passive) is possible with typical well known speaker concepts, but may need few years of experience how to interpret simulation. Full measurement data in two planes (captured by measurement instructions) is required to get all CTA-2034-A plots.
Normal case with methods I use and recommend is that e.g. sound quality of drivers is bigger variable/uncertainty than crossover design. Sometimes power amplifiers too. So multiple prototypes with different drivers may be needed to make more significant quality increase compared to small crossover changes by listening.
Normal case with methods I use and recommend is that e.g. sound quality of drivers is bigger variable/uncertainty than crossover design. Sometimes power amplifiers too. So multiple prototypes with different drivers may be needed to make more significant quality increase compared to small crossover changes by listening.
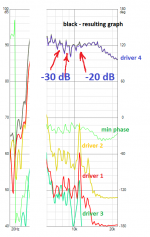
Question about the frequency response graphs. From the resulting graph to the driver graphs at 7-8 kHz -30 dB, at 11 kHz -20 dB. Can a signal that is -20 or -30 dB quieter than the main one affect the main one? I.e. the question is, is the resulting graph calculated correctly in these places?
Attachments
PURIFI PTT6.5W04
Could you add the PURIFI PTT6.5W04 driver to the list of driver available - its getting quite popular for builds.
Many thanks if you can.
^All Purifi transducers in online database. W04 with extended impedance model based on measurement.
Can a signal that is -20 or -30 dB quieter than the main one affect the main one?
-20 dB affects -0.92...+0.83 dB depending on phase difference.
-30 dB => -0.28...+0.27 dB.
Summing accuracy is extremely easy to verify e.g. with ideal/default driver data and textbook LP+HP filter, and exporting total SPL. Error is zero in dB with three decimals.
^All Purifi transducers in online database. W04 with extended impedance model based on measurement.
Thanks - will check it out.
Please excuse my beginner ignorance, I'm trying to narrow down what I need, to start measuring speaker designs. I need software + hardware. I have a Umik-1.
What am I losing, what useful data, if I just use Umik-1 with REW and Xsim vs a proper 2ch mic setup as required with VituixCAD?
What am I losing, what useful data, if I just use Umik-1 with REW and Xsim vs a proper 2ch mic setup as required with VituixCAD?
What am I losing, what useful data, if I just use Umik-1 with REW and Xsim vs a proper 2ch mic setup as required with VituixCAD?
XSim is crossover simulator which has nothing to do with capturing measurement data. Another note that VituixCAD does not require 2ch measurements. It is able work just like XSim if no more than two loaded responses (1 frd, 1 zma) per driver are available. That is not so wise due to very limited perspective to performance.
I just want to recommend single method which is more universal and able to capture timing (relative to selected physical origin of radiator) to all off-axis directions with single setup and without complex data processing. It supports almost any speaker concept providing many directivity plots, CTA-2034-A and much more.
Umik-1 and compatible gear fails with some speaker concepts if target is to simulate full off-axis 0-180 deg, power, DI etc. See post #2323 for more information.
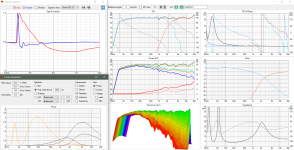
One sample what you can get by following instructions.
Attachments
Kimmosto,
At this point I am interested in measuring phase response -- on axis and up to 60deg off axis. This measurement would be taken in my standard listening room. Then I'd be interested in simulating a phase correction filter.
Would I be able to do this with Umik-1 with REW and Xsim?
Would I be able to do this with VituixCAD and recommended hardware?
Thanks!
Would I be able to do this with Umik-1 with REW and Xsim?
Yes if you finally select single off-axis direction as design axis and can play with filter orders and use conventional all-pass filters and delays.
Would I be able to do this with VituixCAD and recommended hardware?
Of course. All options available including FIR.
P.S. Please ask XSim questions somewhere else. Comparing if so unfair because targets have been too different.
Kimmosto,
regarding my post about incorrectly calculated inductor resistances. Post #2337.
I think I understood the reason for this. When adding an inductor to the circuit, the resistance is calculated correctly. If changing the inductance value many times, upward, then downward, then again, then an incorrectly calculated resistance appears. Maybe this is due to the accumulation of rounding error.
Perhaps you should consider de-selecting DCR and Wire from the specific inductor's optimisation options. Then work with a ballpark series resistance value. The simulator cannot predict what the actual (off-the-shelf) inductor's series resistance is.
When adding an inductor to the circuit, the resistance is calculated correctly.
L=1.0 mH, DCR=0.28 Ohms and Wire=1.4 mm when adding an inductor. Nothing is calculated, just constant initial values drawn from a hat.
Change in DCR is estimated with exponent function when user changes L or Wire. User to enter correct available DCR after adjustments. I will remove this feature if more harm than good. Very simple.
If the behavior of the graph depends on the diameter of the wire, then this is the required parameter. So you don't need to remove it. Each wire diameter + inductance value has its own DCR. DCR is involved in calculating the resulting graph. Right?
I played around and caught a liar. It turned out to be the Wire parameter. When you decrease Wire to its minimum value, and then return it as it was, the DCR turns out to be incorrect. + Wire, for example, was 0.83 mm, becomes 0.81 mm. The same happens when you increase Wire to its maximum value and return as it was.
I played around and caught a liar. It turned out to be the Wire parameter. When you decrease Wire to its minimum value, and then return it as it was, the DCR turns out to be incorrect. + Wire, for example, was 0.83 mm, becomes 0.81 mm. The same happens when you increase Wire to its maximum value and return as it was.
Last edited:
Wire diameter does not affect to simulation. Just L and DCR. Both are finally entered by user or optimised with Optimizer.
Wire diameter is meta data for parts list and auxiliary parameter for calculation of change in DCR when L changes.
Each wire diameter + inductance value can have multiple DCR values depending on materials and mechanical geometry.
Wire diameter is meta data for parts list and auxiliary parameter for calculation of change in DCR when L changes.
Each wire diameter + inductance value can have multiple DCR values depending on materials and mechanical geometry.
Hello Kimmo,
In post 2340 you mention:
Then you can export biquad coefficients including both XO and EQ to miniDSP app with IIR only.
In version 2.0 I could not find the export of coeffs under the Export button.
Where can I find it?How should the export of the coeffs be done once the filter is optimized?
In post 2340 you mention:
Then you can export biquad coefficients including both XO and EQ to miniDSP app with IIR only.
In version 2.0 I could not find the export of coeffs under the Export button.
Where can I find it?How should the export of the coeffs be done once the filter is optimized?
In the Drivers tab, I load FR graphics. Measurements in REW. Then export from mdat to txt. What should be the phase response in the txt file - phase or minimum phase?
How should the export of the coeffs be done once the filter is optimized?
In optimizer: use the TF (top left) to export the selected A👎 buffer's function.
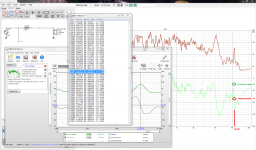
My previous question is caused by a mismatch between the phase response displayed in REW, also in the FR txt file, and displayed in VituixCAD. The frequency response is the same as in the REW. The phase response at 10.9 kHz is shifted 50 degrees downward. The shift is gradual, so it may not be noticed. The graph in REW is zoomed in to show this place.
Attachments
- Home
- Design & Build
- Software Tools
- VituixCAD