The charts are spectra from the wav you recorded. Any changes made prior to the recording (notch filters effects on the harmonics, the gain stage) must be accounted for manually. This is what you would see on your AP if it did not subtract the gain stage (just a Y axis shift) and its FFT was long enough.
IMO the spectra clearly show :
1) the harmonics are where expected, the measurement technique has not eliminated them - good
2) The oscillator frequency is very stable and precise (the 8M FFT has resolution of 0.008Hz), at least for the 50/57 seconds of the recording I used (the 36minutes of 18 averages of 8M FFT were built from the single 57 secs sequence).
Pavel what I don't get is how you end up with 55secs of signal when I recorded 83.xx seconds (4M @ 48k).
Jan
Look at the orig.wav details at https://www.diyaudio.com/forums/equ...n-audio-range-oscillator-900.html#post6203741
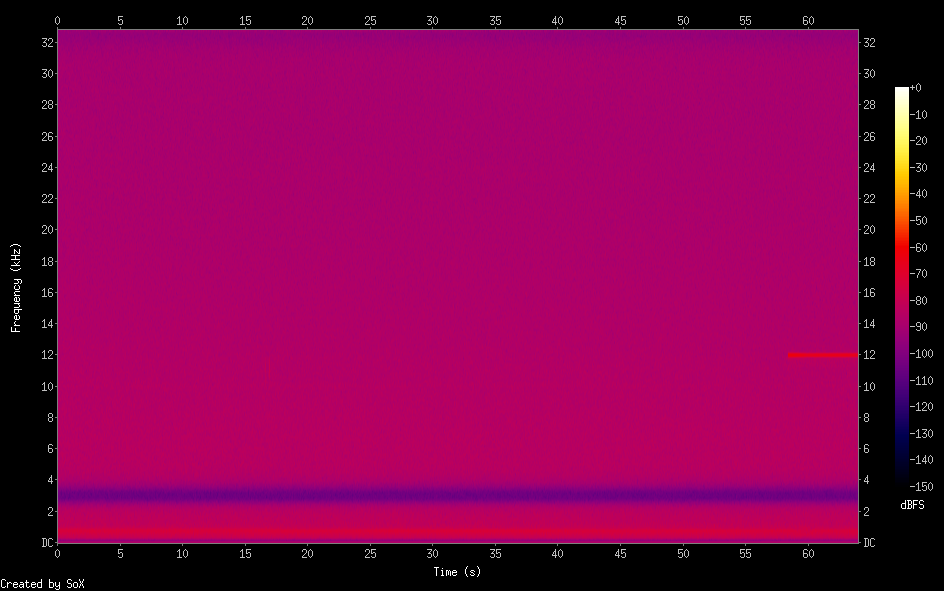
The wav contained incomplete 4M samples (4M = 2^22 = 4194304, the wav has only 4194301 samples) at samplerate 65,536Hz (not 48kHz). That is 64 seconds. The wav spectrum shows the 12kHz noise starts at about 58 secs which I had to trim.
Code:
soxi orig.wav

Input File     : 'orig.wav'
Channels       : 1
Sample Rate    : 65536
Precision      : 24-bit
Duration       : 00:01:04.00 = 4194301 samples ~ 4800 CDDA sectors
File Size      : 12.6M
Bit Rate       : 1.57M
Sample Encoding: 24-bit Signed Integer PCM
The wav contained incomplete 4M samples (4M = 2^22 = 4194304, the wav has only 4194301 samples) at samplerate 65,536Hz (not 48kHz). That is 64 seconds. The wav spectrum shows the 12kHz noise starts at about 58 secs which I had to trim.
One keeps learning every day.
REW allows dropping a file onto the RTA window and it gets processed at its native samplerate as if it was recording (just much faster, of course).
If a generator is running at the same time (even at different samplerate, any value which is available by the currently selected audio device), the generated frequency is used as fundamental for the distortion display.
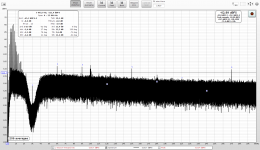
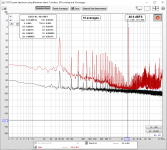
Here is spectrum for 4M FFT 206 averages of 110 minutes of the original 65,536Hz signal (no resampling to 48kHz), all the distortions properly marked and described (their level is dB against the fundamental, therefore positive numbers). Calculating took a few minutes with 2 full CPU cores running.
The significant 9th harmonic(27,026.1Hz) is interesting, my previous jaaa spectrum range was only to 25kHz and the 48kHz resampled signal in REW did not reach so high.
REW allows dropping a file onto the RTA window and it gets processed at its native samplerate as if it was recording (just much faster, of course).
If a generator is running at the same time (even at different samplerate, any value which is available by the currently selected audio device), the generated frequency is used as fundamental for the distortion display.
Here is spectrum for 4M FFT 206 averages of 110 minutes of the original 65,536Hz signal (no resampling to 48kHz), all the distortions properly marked and described (their level is dB against the fundamental, therefore positive numbers). Calculating took a few minutes with 2 full CPU cores running.
The significant 9th harmonic(27,026.1Hz) is interesting, my previous jaaa spectrum range was only to 25kHz and the 48kHz resampled signal in REW did not reach so high.
Attachments
Pavel do I understand that you did 206 averages of the original 4M record I send you? If so, I assume that all those 206 records are identical. Again, if so, does averaging identical records have any effect on the result?
Jan
Jan
The previous time I did not know REW can analyze a file directly, and made a long wav to have enough time to testing - I just left it playing to the loopback device.
The recorded period-aligned sequence is shorter than 4M samples (some 3.7M), therefore the 4M blocks cut from a row of 3.7M blocks are not identical. Averaging visually reduces the noise band for let's say 10 FFT cycles, then it stays basically constant (visually every cycle changes some peaks, but that is unimportant). So yes, 206 cycles are useless for the averaging (my previous charts used up to 20 cycles). I just had the long file available, so I analyzed all of it plus I wanted to test REW at larger loads - fared extremely well, as it always does.
The recorded period-aligned sequence is shorter than 4M samples (some 3.7M), therefore the 4M blocks cut from a row of 3.7M blocks are not identical. Averaging visually reduces the noise band for let's say 10 FFT cycles, then it stays basically constant (visually every cycle changes some peaks, but that is unimportant). So yes, 206 cycles are useless for the averaging (my previous charts used up to 20 cycles). I just had the long file available, so I analyzed all of it plus I wanted to test REW at larger loads - fared extremely well, as it always does.
Ahh yes, get it. Also within the 4M (or 3.7M) there are many records that are not identical.
And my first tests with REW are impressive. Thanks.
Jan
And my first tests with REW are impressive. Thanks.
Jan
I think I am making some progress in measuring the Viktor distortion.
The attached is with 2.7V output, anything lower and all harmonics drown in the noise again.
But I have no idea how much it really is. The RTX generator is set at -10dBFS which I believe is the reference used to set the fundamental in the graph at 0dB. The signal level was 2.7V, the twin-tee attenuates the fund. by 60dB and the 3rd by 64dB.
The 3rd in the graph is around -88dB.
Anyone can do the sums? I wish I could set the reference for the display manually in REW. Although I start to like REW a lot.
Jan
Attachments
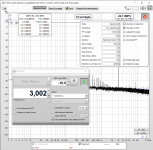
Or maybe this is the correct calculation.
If I enable the display of the fundamental (red stuff), the bottom legend has it as -89.3dBc, and that apparently is the 0dB ref (the red line is exactly at 0dB).
The 3rd I see is 88dB below that. Would it be correct that the 3rd is thus at 89.3 + 88 - 4 (t-t atten) = -173.3 dB below fundamental? We do know it is below -150 dB.
Jan
Attachments
Last edited:
I would recommend to switch the distortion table to dB - in the RTA settings (top right corner icon)
The distortion levels are listed relative to the fundamental - look at the chart at https://www.diyaudio.com/forums/att...low-distortion-audio-range-oscillator-65k-png - the distortions are positive dBs because they are actually above the notch-filtered fundamental. Their dbFS value is fundamental value + distortion value: H2 = -121dBFs + 14.5dB = -106.5dBFs
REW does not know anything about real levels entering the ADC, it just processes the stream of numbers <-1, 1> produced by your ADC (after int -> float conversion, of course).
Last edited:

I would recommend to use the latest beta (you will have to register at avnirvana to see the download button). It has LOTS of changes, among others in the distortions setup.
REW (Room EQ Wizard) Beta Downloads | AV NIRVANA
REW (Room EQ Wizard) Beta Downloads | AV NIRVANA
Ja, I think you should use the latest version, beta 50. I use that and it is stable. You might also want to use 64bit FFT.
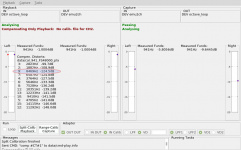
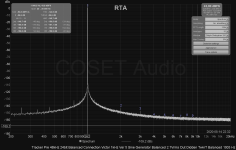
I did this VictorRev5-1kHz and your notch measurement in REW yesterday. You can see my settings in the image. 48kHz. 24bit. Tracker Pre.
Calibration file for notch used.
I did this VictorRev5-1kHz and your notch measurement in REW yesterday. You can see my settings in the image. 48kHz. 24bit. Tracker Pre.
Calibration file for notch used.
But how to interpret that?
Jan
Attachments
I would recommend to use the latest beta (you will have to register at avnirvana to see the download button). It has LOTS of changes, among others in the distortions setup.
REW (Room EQ Wizard) Beta Downloads | AV NIRVANA
I tried to register at Nirwana but never got the confirmation mail.
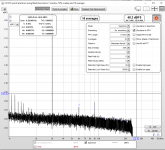
Anyway, remembered to set the sampling rate to lowest values for narrowest bins with lowest noise, set the scale to dBFS and got this, cleanest so far, and numbers that at least make sense.
Jan
Attachments
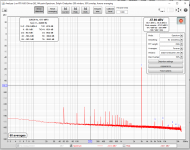
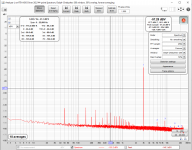
Last for today. Using the latest REW version with more windows and longer FFT (256k). Two plots, Vic @ 2V out and @ 2.7V out, which is close to the maximum.
Note that these graphs are referred to 0dBV so the graph with 2V is actually 6dB better, well below -156dB.
With the 2.7V higher output level it just starts to peak above -150dBV but needs a correction for the 2.7V output, which is about 8.5dB, so it is pretty much still the same as with 2V, better than -156dB.
I think the RTX just beat my AP ...
So, Viktor, this is where your harmonics are ;-)
Jan
Attachments
The 50Hz and multiples is from RTX?
Yes, I think there was a thread here for externalizing the power supply of the RTX (xformer and rectifiers at least, that's where that stuff comes from mainly). I should look that up.
But the spikes are anyway below a microvolt, so no worries I think.
Jan
Last edited:
Thanks, Jan. Probably it is real. As I previously wrote, some boards are better, some distort little more. According my own measurements, practically no one of the last 1kHz boards have harmonics higher than -155dB. It is hard to measure many of them.So, Viktor, this is where your harmonics are ;-)
Jan
Vic.
- Home
- Design & Build
- Equipment & Tools
- Low-distortion Audio-range Oscillator