That's neat !
Assuming thermal equilibrium was achieved, to me that just indicates a tempco related distortion characteristic only for those RN60D, with reference to Jan's initial post.
Fundamental goes up nearly 20dB, so equivalent to increase in bridge excitation.
Assuming thermal equilibrium was achieved, to me that just indicates a tempco related distortion characteristic only for those RN60D, with reference to Jan's initial post.
Fundamental goes up nearly 20dB, so equivalent to increase in bridge excitation.
I would expect a 60 dB increase then: 40 dB from the 100 times increased power fluctuations and 20 dB from the stronger signal.
Hello All,
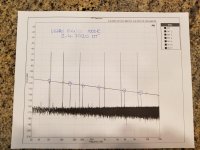
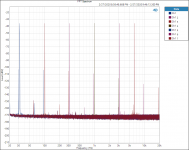
To add a bit of clarity and a reminder that the plots posted in post 214 had a voltage input of 20 volts in frequency stair steps. With the 20 volts input to the bridge the resistors under test had 10 volts across them. 10v times 10v /divided by 1000 Ohms is equal to 0.1 Watts dissipated in each of two resistors or 0.3412 BTU’s/hour heat input per hour.
In the plots what looks like the “fundamental” is the bridge leakage voltage in dBV. On the plot what looks like -42dBV is in fact +20dBV. For the 3kHZ 3rd Harmonic at -120dBV is -143dB relative to the +20dBV input voltage.
I appended the frequency stair steps on a plot and by hand added a straight line across the 3rd Harmonic peaks. The math for the straight line is straight forward.
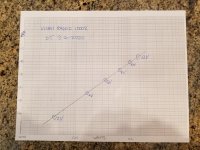
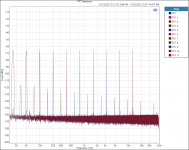
For the plots in post 220 I held the frequency constant and varied the voltage input. See the plots. Using the voltage input across the resistor I calculated the watts dissipation at each input voltage 2v, 4v, 6v, 8v, 10v and 12v.
On the Y axis is the 3rd H and on the X axis is the calculated Watts.
Once again the 3rd Harmonic peaks are connected with a straight line.
I am getting a better idea of the distortion of thin (metal) film resistors. I have other resistor values to test if there is interest.
Thanks DT
To add a bit of clarity and a reminder that the plots posted in post 214 had a voltage input of 20 volts in frequency stair steps. With the 20 volts input to the bridge the resistors under test had 10 volts across them. 10v times 10v /divided by 1000 Ohms is equal to 0.1 Watts dissipated in each of two resistors or 0.3412 BTU’s/hour heat input per hour.
In the plots what looks like the “fundamental” is the bridge leakage voltage in dBV. On the plot what looks like -42dBV is in fact +20dBV. For the 3kHZ 3rd Harmonic at -120dBV is -143dB relative to the +20dBV input voltage.
I appended the frequency stair steps on a plot and by hand added a straight line across the 3rd Harmonic peaks. The math for the straight line is straight forward.
For the plots in post 220 I held the frequency constant and varied the voltage input. See the plots. Using the voltage input across the resistor I calculated the watts dissipation at each input voltage 2v, 4v, 6v, 8v, 10v and 12v.
On the Y axis is the 3rd H and on the X axis is the calculated Watts.
Once again the 3rd Harmonic peaks are connected with a straight line.
I am getting a better idea of the distortion of thin (metal) film resistors. I have other resistor values to test if there is interest.
Thanks DT
Attachments
Last edited:
-162 dBV third harmonic level at 2 V fundamental
-120 dBV third harmonic level at 10 V fundamental
Nearly perfect third-order slope.
-120 dBV third harmonic level at 10 V fundamental
Nearly perfect third-order slope.
Link to another thread that may be relevant:
https://www.diyaudio.com/forums/parts/349439-resistor-sound-minus-snake-oil-2.html#post6079180
https://www.diyaudio.com/forums/parts/349439-resistor-sound-minus-snake-oil-2.html#post6079180
DT, these are all interesting results. Not the increase with lower F and higher P, that we should expect.
But the neat straight line slopes through the various points gives even more credibility to the test method.
I should also mention that Ed Simon has agreed to do similar (I believe) tests on some Vishay Zfoil resistors and some precision miniMELF resistors.
That will then add even more to our store of understanding of such issues and, hopefully, help us to select the best resistor for a particular job with predictable results.
This thread should become a sticky.
Jan
Hello All,
Radiation, conduction, convection or evaporation, what is it?
Thermal management!
If you look at the resistor data sheets and manufacturer resistor white papers you will notice that all the resistor Temperature Coefficient of Resistance, Voltage Coefficient of Resistance and similar data is tested at static conditions. Static as in DC, there is no AC involved in the testing and reporting of TCR, for example.
The dc voltage is switched on and the resistive element heats due to “self-heating”. The heat dissipates from the resistive element into the ceramic resistor former/core (if there is one). The heat in the former then dissipates into the metal end caps.
Through hole resistors with wire leads dissipate 80% ish of their heat by convection and 20% ish by conduction through the wire leads into the PCB. Smaller body TH resistors dissipate an increasing percentage of their heat through wire lead conduction.
For surface mount resistors soldered to a PCB the dissipation is the other way about; 20% ish by convection and 80% ish by conduction.
The DC voltage is turned on, the heat and dissipation mechanisms are allowed to stabilize, and then an Infrared sensor is used to measure the temperatures. At this static condition the “hot” resistances are measured/calculated. Then the hot and cold resistances are put into a spread sheet and the stable TCR’s are calculated. Interesting to me, a resistor does not have a fixed TCR, it changes with input voltage and temperature.
Switch on the DC voltage and the resistive element will “self-heat”. The IR camera will show a “hot spot” at the center of the resistor. Depending on the resistor construction the heat from the “hot spot” will dissipate at different rates. You can lump together a resistance to heat flow parameter for a given resistor (Rth). You can measure/calculate a resistor temperature Time Constant; the time it takes the resistor to reach 63% of its stable temperature under a specific load. Short version, it takes time for the resistor to come up to a stable temperature under load. Look at the Vishay Naked Z-Foil resistor data sheet, “Thermal stabilization time < 1 s (nominal value achieved within 10ppm of steady state)”. The Thin (metal) Film data sheets do not show anything about “Thermal stabilization time”. The Thin (metal) Film resistors are not “Naked”, they have a ceramic resistor former/core that adds thermal mass. The thermal mass of the Thin (metal) Film ceramic resistor former/core will extend the “Thermal stabilization time” compared to the VART “Naked” Z-Foil resistor.
Now we change the applied voltage from DC to AC. At 20hZ the AC voltage crosses 0volts twice for each Sine cycle. 20hZ times 2 0volt crossings per 1hZ is 40 heating and cooling cycles per second. One heating, cooling cycle is 0.025 seconds. At 2000hZ that is 0.00025 seconds per heating and cooling cycle. The resistor temperature never is stable with AC voltage applied. As the frequency increases there is less time for the resistor temperature to change.
Perhaps a bit counter intuitive the resistor temperature magnitude swings decrease as the frequency increases. This is the stuff of reduced distortion; smaller slower temperature change, reduced distortion.
A few weeks ago I posted FFT plots for Vishay S102 Z-Foil resistors. The Z-Foil resistors had higher distortion than RN65, RN60, RN55 and PTF65 Thin (metal) film resistors.
Jan,
Today I am expecting from Mouser a pair of Vishay VART “Naked” Z-Foil 1000Ohm resistors to test.
The mini-MELF resistors are surface mount and should be tested soldered to a PCB. The larger physical size MELF resistors are likely to be more thermally stable than the mini’s. I think.
Thanks DT
https://www.vishay.com/docs/52027/thermmgt.pdf
http://www.vishay.com/docs/30380/terminalderating.pdf
Time constant - Wikipedia
Indirectly Heated PTC Resistor for Measuring Air Flow - ScienceDirect
https://www.digikey.ca/en/videos/v/vishay-foil-resistors-vpg/power-coefficient-of-resistance-pcr
https://thermtest.com/keeping-your-warm-drinks-warm-a-thermal-properties-approach
https://www.substech.com/dokuwiki/doku.php?id=thermal_properties_of_ceramics#specific_heat_capacity
https://www.mouser.com/datasheet/2/428/var-2933.pdf
Last edited:
Can't say I disagree, good write-up.
One comment if I may: the whole resistor mass and its cooling mechanisms (radiation, conduction) form a low pass filter for the heat input. Just as an RC fed with AC shows less and less ripple across the C with increasing frequency, so will the resistor temperature show less and less 'ripple' with increasing temperature.
I expect that at 1kHz and above the resistance modulation due to the temperature modulation is unmeasureable.
But lets also see what Ed Simon finds.
Jan
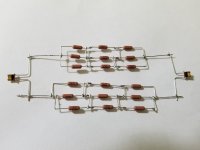
This is what “Naked” looks like.
Hello All,
This is what “Naked” looks like.
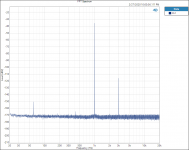
This is a 1000r VAR, Vishay Audio Resistor.
This is 20volts 1M FFT length and 20 averages.
The distortion is a couple of dB’s improvement over the non “Naked” Z-Foil resistor but not nearly as good as the PTF65 5ppm, RN60 25ppm or RN65 100ppm resistors.
I think that is all about thermal mass and thermal time constant, more about that later.
Thanks DT
Hello All,
This is what “Naked” looks like.
This is a 1000r VAR, Vishay Audio Resistor.
This is 20volts 1M FFT length and 20 averages.
The distortion is a couple of dB’s improvement over the non “Naked” Z-Foil resistor but not nearly as good as the PTF65 5ppm, RN60 25ppm or RN65 100ppm resistors.
I think that is all about thermal mass and thermal time constant, more about that later.
Thanks DT
Attachments
Hello All,
We have been poking and prodding into resistor distortion. The best that I can figure is that resistor distortion is a function of the range and rate of temperature change verses frequency. There are lots of details in the mix. When the range of temperature change is small and the thermal inertia is large the TCR caused distortion is tiny. So tiny in fact that those that say that resistors are passive devices and do not cause distortion may begin to believe that they are correct. Distortion does show up in the FFT plots.
FFT’s are frequency domain measurements. The samples are large and averaged over many sweeps. On the FFT plots the noise seems to melt away making the distortion harmonics stand out above the apparent “Noise Floor”. The apparent “Noise Floor” is even pushed down further using the Bridge method. Common mode noise from the AP Analyzer generator is nulled across the bridge.
The FFT apparent “Noise Floor” is nowhere near the actual real time domain noise.
While we are all locked in our labs trying to avoid our turn with the virus I have “The Art of Electronics” second edition sitting open on my desk. Every resistor has Johnson Noise, Shot Noise and to some degree 1/f noise.
The question is; where is the point that the TCR caused distortion sticks it head above the real time noise and becomes measurable perhaps even audible without the bridge, extreme sample size and extensive averaging?
Thanks DT
First step, I suppose is to sort putting an FFT method together that shows the FFT noise Floor at the real time noise voltage. I recall seeing an Audio Precision Note on the topic some time ago.
Also see attached plot(s) from Vishay PTF56 54.9R at 6.3Volts. 3rd H continues to gradually taper with input well above 20khZ.
Attachments
Last edited:
What do you mean by the "real time noise voltage" and why do you consider it relevant?
Suppose you have a resistor with resistance R and parasitic shunt capacitance C. The thermal noise will then generate a noise with RMS value sqrt(kT/C) across the resistor, but when RC << 8 us, most of the noise will be above the range of frequencies that are audible for humans, and when RC << 800 ns, the same holds for most bat species. So why would this be relevant for audio?
The mammalian auditory system itself is somewhat similar to a spectrum analyser, with the basilar membrane essentially acting as a filter bank. So why not look at the noise over one critical bandwidth, if you should want to compare distortion and noise?
Last edited:
Leave the capacitor out of it.
Every resistor has Johnson Noise, Shot Noise and to some degree 1/f noise.
Leave the FFT frequency domain with extreme sample size and extensive averaging and think (real) time domain. Low level harmonics are easily buried in noise. Even in the frequency domain with small samples and only one average low level harmonics are easily lost in the noise floor.
The harmonics we are measuring with the bridge method are at or below -160dBV’s. This is below the threshold/noise floor of the best analyzers.
The AP analyzer allows us to pick the fly poop out of the pepper. Measurement wise it does make a difference at least when you are attempting to build a better analyzer or the best measuring headphone amplifier.
Otherwise in the time domain the noise may just be louder than the distortion we are measuring. Or is that the goal; minimize noise and then minimize distortion?
Plus we do want the option of selecting the best resistor for the application.
Thanks DT
Distortion has a line spectrum and noise has a continuous spectrum. You need to have some sort of bandwidth limitation to compare them.
The point is that when you leave out the parasitic capacitance and leave out bandwidth limitations of the auditory system, you only have the Planck factor to limit the noise bandwidth of the thermal noise (a.k.a. Johnson noise). That means you will have a bandwidth of about 4 THz at room temperature and a noise of about 8 mV for a 1 kohm resistor. (This value may be somewhat inaccurate as I just multiplied the low-frequency asymptote with the bandwidth instead of integrating the Planck factor from 0 to infinity, but it shows the order of magnitude.) So then anything below -42 dBV drowns in the noise.
Hence my question about what you mean by real time noise voltage. What bandwidth limitations do you take into account to prevent getting the absurd result I just calculated?
Last edited:
One of the 1,000 ohm Naked Vishay resistors I am currently measuring has third harmonic distortion above -150 even at low power (7.5 VACRMS.) The noise of a 1,000 ohm resistor is around 60 nV per root hertz. The square root of the critical bandwidth at 1,000 Hz. would be around 15 for a perceived noise level of 900 nV. So I would expect the distortion to be perceived above the noise level at a voltage across the resistor above 11 volts.
But still doing measurements, more later.
But still doing measurements, more later.
The noise of a 1,000 ohm resistor is around 60 nV per root hertz.
I'm having trouble following you here. I expect a 1 kΩ resistor to produce about 4 nV/rt Hz, and for 60 nV/rt Hz to be produced from a 220k resistor. What am I missing?
I'm having trouble following you here. I expect a 1 kΩ resistor to produce about 4 nV/rt Hz, and for 60 nV/rt Hz to be produced from a 220k resistor. What am I missing?
You are right it is around 4 nV per Hz, so 60 nV for the critical band. So that drops the distortion voltage much lower. If I did it right this time under 4 volts cross the resistor. My bad!
One of the 1,000 ohm Naked Vishay resistors I am currently measuring has third harmonic distortion above -150 even at low power (7.5 VACRMS.) The noise of a 1,000 ohm resistor is around 60 nV per root hertz. The square root of the critical bandwidth at 1,000 Hz. would be around 15 for a perceived noise level of 900 nV. So I would expect the distortion to be perceived above the noise level at a voltage across the resistor above 11 volts.
But still doing measurements, more later.
Ed do you have any (preliminary?) results for the MELF resistors?
Jan
So I would expect the distortion to be perceived above the noise level at a voltage across the resistor above 11 volts.
What pre-amp and line level circuits run at 11V output?
What pre-amp and line level circuits run at 11V output?
In audio, power amplifiers. But folks do use them for things other tan audio.
Ed do you have any (preliminary?) results for the MELF resistors?
Jan
I can do some next. Still getting the bugs out of measuring -160 re test signal levels. Takes a bit of time for each measurements in an electrically quiet environment, even with the shielded box.
- Home
- Design & Build
- Parts
- What causes resistor distortion?