Yes, and for sweeps too.For checking that the FR is level dependant, we need pink noise curves recorded at different levels on one and the same record, once on our diyAudio LP list.
The issue of crest factor might be significant perhaps? Pink noise peak level is +12dB above rms level or so it's reckoned. I wonder what rms level the PN test tracks you and Scott used is ? Playing back at 45rpm will lift rms level by 2.6dB which might be enough to make crest factor a traceability/trackability issue?
PN is about statistical pseudo-random groove shapes, it's tough to get out of the habit of thinking about sine shapes.
LD
Pink noise is specifically shaped for equal energy per octave band, which is useful for fixed bandwidth spectrum analyzers, but results in falling energy with rising spectrum. Not that it shouldn't be included, but for this test I would think spot frequencies or sweeps would be more useful. Especially if recorded without RIAA.
Yes, and for sweeps too.
The issue of crest factor might be significant perhaps? Pink noise peak level is +12dB above rms level or so it's reckoned.
This is another can of worms, digitally generated noise can have the crest factor controlled up to a point. I know the statistics for gaussian white noise, but never did much work with pink. I already checked the crest factor and the different LP's vary a little but 11-13dB cover it fairly well. The Adjust + is recorded at -20dB, not sure about the CH but they lie on the lable it clearly has a low frequency rolloff before 250Hz.
Spectral contamination in multi-tone signals tends to be worse at the high frequencies, it is possible correcting something like this would be speed/level dependent.
Since what is being tested is level dependent behavior, the high crest factor of pink noise would only make this more difficult. You'd probably get a better picture with spot/stepped tones with levels stepped as well.This is another can of worms, digitally generated noise can have the crest factor controlled up to a point. I know the statistics for gaussian white noise, but never did much work with pink. I already checked the crest factor and the different LP's vary a little but 11-13dB cover it fairly well. The Adjust + is recorded at -20dB, not sure about the CH but they lie on the lable it clearly has a low frequency rolloff before 250Hz.
You can generate pink with different crest factors. We run into this with, for example, different cal signals present in theater and large sound system equalization methods. But it's really not a big issue so long as it's known and published. But again, pink noise is specifically for use with fixed bandwidth real-time analysis. It's a rather poor indicator of anything but frequency response (when viewed on an RTA), and in a system with radical pre/de-emphasis involved in the hunt for changes in dynamic performance, it's not going to return a very complete picture. Good to have, but far from a good means to get a complete profile.
Yes, it's worse at higher frequencies, but once it's there, it's really difficult to correct for it because of the complex nature of the mechanism that causes it. Yes, it's going to be both speed and level dependent.Spectral contamination in multi-tone signals tends to be worse at the high frequencies, it is possible correcting something like this would be speed/level dependent.
Well that is the $64m question.
Let's assume that RIAA correction modified for playback speed is correct, and that playback levels are not demanding for traceability/trackability.
Then the obvious factors that change with rpm are playback level and slew rate at cartridge output. And we are back to the OP question of whether f response is level dependent, and if so why...……….?
I had reached the conclusion previously that was likely true, and speculated it is due to generator magnetic loss performance at small levels, but that seems to have been shown false.
LD
I'm not convinced that in this case Cart level dependency plays any role, because to my opinion there is no level change for one and the same frequency when changing rpm.
I hope I’m successful in explaining why.
Take 20kHz and 27kHz from a Pink Noise spectrum at 45rpm.
With PN, output level at 20kHz and after Riaa will be 1.3dB higher than at 27kHz.
Before Riaa level of 20kHz will be 1.3dB below 27kHz.
Now play this record at 33 1/3 rpm and 27kHz will become 20kHz but at a 1.3dB* lower level before the preamp, just as the original 20kHz at 45rpm.
But because of the Riaa correction, with 2.6dB less attenuation at 20kHz, it will show up at 1.3dB above the level it had before at 27kHz.
So the original 27kHz at 45rpm, now being 20kHz at 33 1/3rpm, has been transformed into exactly the same level as 20kHz at 45rpm..
And since there is no level change, 20kHz at 33 1/3 should show exactly the same level as 20kHz at 45rpm.
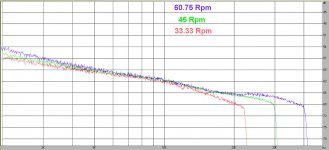
*The prove for the above is that from 10kHz and downwards, the curves for 33 1/3, 45 and 60.75rpm are lying on top of each other, see image below, all being recorded at the same Fs, FFT setting and amp gain.
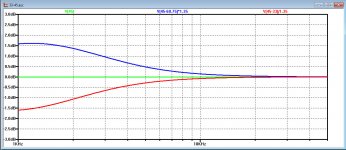
That they are drifting apart towards 2kHz has everything to do with the wrong pre-emphasis, see second image, but when corrected for this deviation, they are exactly on top of each other
So when seeing that curves are no longer on top of each other, which is most prominent the case with 33 1/3 vs 45 rpm from 10kHz to 20kHz, only the Record can be blamed for causing a different output and not the level dependency of the Cart.
Hans
Attachments
Since what is being tested is level dependent behavior,
No actually this side show is about why the pink noise tracks on different test LP's are so different and behave the way they do. There unfortunately are not any test LP's with sweeps at multiple levels because this is not something anyone expected to be of any use.
A correction to my posting concerning the level change.
When the record goes from 45rpm to 33 1/3rpm , level before Riaa does not drop by 1.3dB but by 2.6dB.
But the Riaa curves does two things:
1) attenuation at 20kHz is 2,6dB less than at 27kHz, bringing the level to 0dB, but
2) the pre-emphasis error is also causing an extra boost.
So that the curves are on top of each other has everything to do with the pre-emphasis error, but in fact the level of the signal is indeed a bit lower at 33 1/3 rpm as at 45 rpm for the same frequency , bit only some 1.5dB.
It is hard to believe that such a small change in level, leads to such a large difference between the 33 1/3 and the 45 rpm FR curve.
What is recorded onto the record is fixed no matter what rpm playback is. So long as RIAA correction is properly modified, there should be no error and so I think the theoretical level difference across the spectrum is 2.6dB. Which is still small.A correction to my posting concerning the level change.
When the record goes from 45rpm to 33 1/3rpm , level before Riaa does not drop by 1.3dB but by 2.6dB.
But the Riaa curves does two things:
1) attenuation at 20kHz is 2,6dB less than at 27kHz, bringing the level to 0dB, but
2) the pre-emphasis error is also causing an extra boost.
So that the curves are on top of each other has everything to do with the pre-emphasis error, but in fact the level of the signal is indeed a bit lower at 33 1/3 rpm as at 45 rpm for the same frequency , bit only some 1.5dB.
It is hard to believe that such a small change in level, leads to such a large difference between the 33 1/3 and the 45 rpm FR curve.
However, small incremental changes might have profound effect if the pink noise peak level is at or near the limit of trackability I suppose? Hence my post about crest factor at +12dB above rms level.
Also, I've been thinking further about pink noise in this context. Pink noise has constant slew rate per Hz. Then peak slew rate recorded on the test record depends upon bandwidth of the cutting path (including the source recording)and rms recorded level.
Then I wonder if it's accidentally possible to cut (or attempt to cut) high slew rates, ie very tight curvatures/accelerations with pink noise? For example, by having high bandwidth in the source material, or too high rms level?
This is separate from crest factor, which affects level and might be all that was thought about (if it was at all?).
Pink noise spectrum most closely follows real programme material spectrum overall. So it would/could also affect real programme material I suppose?
I am having a go at calculating likely peak programme slew rate arising for a -18dB rms pink noise track. This is complicated by, and made far worse by RIAA recording emphasis.
LD
Last edited:
First outcome of calculation is that RIAA recording emphasis increases both rms and peak slew rate of pink noise with a 20kHz bandwidth by about +13.8dB.
A factor of about 5.
Since slew rate equates to groove curvature and stylus acceleration, +13dB seems potentially significant, methinks.
This would also roughly be true for programme material in general, since it generally follows a similar spectral content law.
Pink noise is statistically random, so events in slew rate are distributed in the time domain. This is different from sine wave tests which are well defined and periodic in the time domain.
On one hand this seems obvious. But I never knew that and haven't seen it discussed anywhere, and I wonder if it was known back in the day?
LD
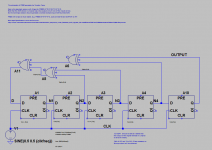
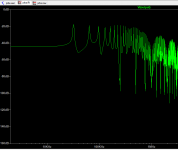
I took a look at a simple 5 stage PRBS white noise generator, common a few decades ago with a low pass to make pink noise.
You can see a serious glitch at around 30kHz
A different clock or shift register length would move the glitch wherever you want it
You can see a serious glitch at around 30kHz
A different clock or shift register length would move the glitch wherever you want it
Attachments
I did another experiment last night that reminded me of a second correction needed when running LP's at different speeds. You need to correct for your cartridge's deviation from ideal constant velocity behavior.
I saved the data from a test I had run a while ago. I spun up a 3150kHz track by hand and let the table spin down with different tracking forces to see any drag effects. This time I correlated the frequency and amplitude data and after correcting for RIAA and constant velocity I was left with an identical match to an independent measurement using a constant velocity sweep and no RIAA. The range was 680Hz to 4800Hz and caught the mid-dip. This is a much wider RPM range, something like 7.2 to 50.8.
I saved the data from a test I had run a while ago. I spun up a 3150kHz track by hand and let the table spin down with different tracking forces to see any drag effects. This time I correlated the frequency and amplitude data and after correcting for RIAA and constant velocity I was left with an identical match to an independent measurement using a constant velocity sweep and no RIAA. The range was 680Hz to 4800Hz and caught the mid-dip. This is a much wider RPM range, something like 7.2 to 50.8.
I still find it hard to get my fingers behind this problem, whatever I do, I can only get the spectra on top of each other when the signal level drops by 1.3db and not by 2.6dB when going from 45rpm to 33 1/3 rpm.What is recorded onto the record is fixed no matter what rpm playback is. So long as RIAA correction is properly modified, there should be no error and so I think the theoretical level difference across the spectrum is 2.6dB. Which is still small.
Could it be that the Cart output goes down with a sqrt instead of linear when lowering speed ?
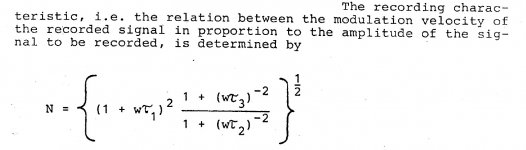
In a link given by George, I found the info below from an Ortofon record cutting machine, showing a sqrt ratio between modulation and signal amplitude, see image below.
Recorded Pink Noise is specified as -20dB.However, small incremental changes might have profound effect if the pink noise peak level is at or near the limit of trackability I suppose? Hence my post about crest factor at +12dB above rms level.
To know what this means, I recorded a 1Khz tone at -20db.
The level of this 1kHz tone was 28dB above 1Khz in the Pink Noise signal in a 6Hz bin, so level at 20kHz after and before Riaa is resp. at -(20dB+41dB)=-61dB and -41db, these values still in a 6Hz bin.
This -41dB is hopefully low enough in volume to stay away from nasty slew rate and crest factor problems.
Hans
Attachments
Last edited:
Crest factor could be really significant. I was just recalibrating my GR 1381 noise generator (similar to what may have been used then). When set up properly I get for 3V RMS with no clipping set I get 14V+ peaks often. That's a significant crest factor. The GR generators with pink noise don't have the clipping (2 sigma to 5 sigma) feature so they will have this crest factor. I don't think a rolloff will affect the crest factor, it should not by definition.
Say the record groove makes angle a laterally with the linear direction. If linear velocity is v, stylus will move laterally at velocity V' = v tan(a). So lateral velocity of stylus is directly proportional to linear velocity, ie rpm. (1)Could it be that the Cart output goes down with a sqrt instead of linear when lowering speed ?
Assuming generator end of cantilever follows lateral motion of the stylus, and generator sits in a uniform field, constant velocity of the stylus laterally will produce constant rate of change of flux in cartridge coil. (2)
Faraday insists coil emf (ie cart output) is directly proportional to rate of change of flux. (3)
So from (3) and (2) cart output emf is directly proportional to lateral velocity of stylus and from (1) therefore directly proportional to linear velocity.
So 'no' is the answer. At least in spherical cow land.
Don't know what that equation defines, but whatever it is a dimensionless correction constant? Seems to be some frequency compensation, and the sqrt term cancels. If all the terms in tor are zero, the constant is one. I think this is a red herring, probably.In a link given by George, I found the info below from an Ortofon record cutting machine, showing a sqrt ratio between modulation and signal amplitude, see image below.
Presumably -20dB for the pink noise test track refers to rms level, which is a statistical matter. Pink noise is statistically random in the time domain with a 1/f gaussian spectral probability distribution. This means instantaneous level varies massively but 12dB above rms level is said to reasonably cover likely peak excursions.Recorded Pink Noise is specified as -20dB.
To know what this means, I recorded a 1Khz tone at -20db.
So -20dB pink noise ought to have peak instantaneous level about -8dB at face value which should be fine in the sense that corresponding instantaneous groove angle will be modest.
However...……...it's not that simple I think. One can't say much about the spectral content of peak events, but they could statistically contain lots of hf all at once. And then RIAA emphasis becomes involved, which significantly boosts recorded level of any such event which is transient with lots of hf. And then -8dB doesn't seem like much headroom, in context of RIAA +13dB boost at say 10kHz.
So normal crest factors might not apply to the physical groove shape as recorded post RIAA emphasis?
What's more, there's slew rate to consider...……..still trying to even calculate what peak slew rate arises from say -20dB pink noise with 20kHz bandwidth?
Pink noise presents time domain challenges, and is very different from the tidy world of sine waves we all were schooled with.
LD
Last edited:
Attachments
Thx George, that's a good read anyways. Interesting that cutter feedback gain was controllable via a pot...…….one would think, by design, there was an optimal setting.
Anyways, that equation simply describes RIAA compensation gain as a function of f, in different form from what's usually presented. The three time constants are the poles and zero from RIAA emphasis/deemphasis.
I'm sure that equation is a red herring.
LD
Last edited:
Say the record groove makes angle a laterally with the linear direction. If linear velocity is v, stylus will move laterally at velocity V' = v tan(a). So lateral velocity of stylus is directly proportional to linear velocity, ie rpm. (1)
Assuming generator end of cantilever follows lateral motion of the stylus, and generator sits in a uniform field, constant velocity of the stylus laterally will produce constant rate of change of flux in cartridge coil. (2)
Faraday insists coil emf (ie cart output) is directly proportional to rate of change of flux. (3)
So from (3) and (2) cart output emf is directly proportional to lateral velocity of stylus and from (1) therefore directly proportional to linear velocity.
That was also my line of thinking and that was the reason why I made a correction #847 to my previous posting in #845.
But's let's face the facts:
1) the recorded images in #845 from 5Khz to 10kHz are on top of each other to within +/-0,5dB, all taken with exactly the same settings and being reproducbly within tenths of a dB.
After correcting for the Riaa Pre-emphasis error, also shown in #845, they are within +/-0.5dB from 2kHz to 10kHz.
2) The Riaa curve between 7.4kHz and 10kHz, goes down with 20dB/oct, so when shifting 10kHz down by a factor 1.35 to 7.4kHz, Riaa will attenuate this downshifted frequency 2.6dB less after shifting.
3) In a Pink Noise spectrum 7.4kHz lies 1.3dB above 10Khz
-Said image shows that the new 7.4kHz at 33 1/3rpm came up by 1.3dB within 0.5dB on the same level as 7.4kHz at 45rpm. (3)
-Riaa boosted the new 7.4kHz by 2.6dB (2)
-The only remaining 3rd variable is now the reduction in output level because of reducing the speed by a factor 1.35.
So to get the final 1.3dB lift after first being boosted by 2.6db by Riaa, level reduction by playing at a lower speed can only be 2.6-1.3 = 1.3dB.
Resolution of the images are to such a degree, that when level reduction would have been 2.6dB instead of 1.3dB, this extra shift of 1.3dB would have been clearly visible.
However this is not being the case.
So could it be that it is power that goes down by a factor 1.35 and not the output voltage ? In that case we would have solved the problem.
On top of that, I cannot neglect that for a record-cutter "the relation between modulation velocity and the recorded signal in proportion to the signal to be recorded" shows an obvious sqrt relation, why is that ?
To say this to be a red herring, seems a bit simple. 😀
Hans
Hans, both your plots of surface noise (#817,#820) show a break at 10k from a constant slope, can you calibrate with a constant velocity sweep and none of these math corrections?
That article is old school 10*log(V**2) = 20*log(V) it's just the RIAA equation.
That article is old school 10*log(V**2) = 20*log(V) it's just the RIAA equation.
Last edited:
Yes, you and LD are right about the article, it's just the Re part of the Riaa curve, so it's a red Herring after all. It's my handicap that I always want to understand things. 😀Hans, both your plots of surface noise (#817,#820) show a break at 10k from a constant slope, can you calibrate with a constant velocity sweep and none of these math corrections?
That article is old school 10*log(V**2) = 20*log(V) it's just the RIAA equation.
About a constant velocity sweep, I thought the Adjust+ Lp had one, but it turns out to have a 10dB/dec roll of curve.
I'll search further to see whether I can find one somewhere else.
But for the time being, because things where starting to drifting apart from 10kHz and upwards, that's why I restricted my above comment to the frequencies below 10kHz.
Problem still to be solved for this part of the frequency range.
And just as an side remark, I know it's just a spec, but my Cart is supposed to be flat within +/- 1dB from 10Hz to 50kHz, so in some way that could be seen as an indication.
The 45rpm Pink noise curve seemed to confirm this up to 30kHz IMO.
Hans
Attachments

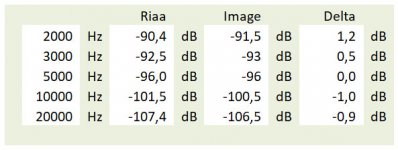
What I can offer you so far is the following.Hans, both your plots of surface noise (#817,#820) show a break at 10k from a constant slope, can you calibrate with a constant velocity sweep and none of these math corrections?
Starting with the assumption that noise from the LP is flat, after Riaa compensation it will have to follow the Riaa curve.
That's why I compared both, after having brought Riaa to the same level at 5kHz.
Image below shows 1) the exact Riaa, 2) the measured data and 3) the deviation.
I don't see an indication that something is going very wrong IMHO.
Hans
Attachments
- Status
- Not open for further replies.
- Home
- Source & Line
- Analogue Source
- Cartridge dynamic behaviour