Why does Xsim extend response curves?
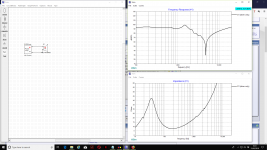
I created frd and zma data for a Volt RM3863 woofer from Volt's published curves using GraphTracer. Opening both files with Notepad confirmed the data is correct. Both load OK into Xsim but the frequency response is extended beyond the loaded data. It looks like Xsim has created an additional response curve from the cut-off at just under 5KHz. There is no data in the frd file after that cut-off.
Screenshot attached. Can anyone help?
Attachments
That's interesting. There is no data point beyond 5K? Nothing at the very top? I've seen other programs, like PCD do that if there is one data point at the top end.
I'll edit an FRD to 5K to see what I get.
I'll edit an FRD to 5K to see what I get.
Just checked. I see the same curve you have after tracing the Volt RV3863. There is an added curve at the top end.
My FRD file tops out at:
3704.840549 70.434904 0
which is where to published graph ends.
My FRD file tops out at:
3704.840549 70.434904 0
which is where to published graph ends.
These are captured with VituixCAD which has automatic extrapolation. Manual editing is not always needed.
Volt RV8363.zma
Volt RV8363 hor 0.frd
Volt RV8363.zma
Volt RV8363 hor 0.frd
That one plots down at an angle after 3.7K. It should, as you can see that Vituix has added the data above that point. 
Driver files
Thanks for the two files. They upload fine to Xsim and look right.
I have the drivers on order to build a 3-way TL with Volt VM752 and scanspeak D2904/710003. I will use Omnimic to create the frd and zma files "in the box" but I wanted to do some crossover simulations first.
Any idea why Xsim does this?
^bwaslo can give exact answer, but looks that there is extrapolation with last two data points with linear magnitude scale (not dB). That could work, but it's not very reliable in practice. Program expects that captured magnitude data covers whole 20..20000 Hz, or you have added single data point to >=20 kHz for guiding interpolation. Composed data point eliminates need of extrapolation.
Automatic extrapolation with slope detection by the last 1/3...2 octaves would read responses without nagging, but we can't expect perfect result because original data is unknown. Extrapolation with manual slope setting wouldn't change that. Fortunately manual editing is not a problem with standard XSim because is doesn't use tens...hundreds of response measurements. Some other simulators such as VituixCAD need stable automatic extrapolation with slope detection because projects could include hundreds of responses.
Automatic extrapolation with slope detection by the last 1/3...2 octaves would read responses without nagging, but we can't expect perfect result because original data is unknown. Extrapolation with manual slope setting wouldn't change that. Fortunately manual editing is not a problem with standard XSim because is doesn't use tens...hundreds of response measurements. Some other simulators such as VituixCAD need stable automatic extrapolation with slope detection because projects could include hundreds of responses.
Extra data points
Thanks Kimmo. So if I edit the files to add data points at 20Hz and 20KHz Xsim won't interpolate higher levels?
Incidentally, using Windows 10 and Excel to create .txt files works OK but if I try to rename the file extensions to .frd or .zma I get for example "filename.frd.txt". How do I get rid of the .txt extension? Even if it doesn't show in Explorer the .txt is still there under "properties" and Xsim won't import the files.
Will I burn out my tweeter?
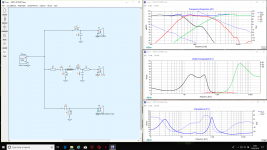
Just tried my first 3-way X/O using Xsim and it looks OK with a level response and reasonable impedance curve. Problem is if the amplifier is producing 50 watts the woofer is dissipating 70 watts over a broad band and the tweeter is hitting 110 watts at 5KHz.
Have I done something wrong or discovered a perpetual motion power source?😕
Attachments
I normally set Windows folder view to show all extension, that way I can see and edit file extensions as needed. Is your set that way?
Then you should be able to just rename the file and eliminate the .txt
Or you can save as "all files" and supply the .frd extension.
Or you can save as "all files" and supply the .frd extension.
Problem is if the amplifier is producing 50 watts the woofer is dissipating 70 watts over a broad band and the tweeter is hitting 110 watts at 5KHz.
...
Have I done something wrong or discovered a perpetual motion power source?😕
😀 Do not mind too much about power reading you see in the amplifier block because it is theoretical value if the load would be constant resistive 8 (or 4) Ohms. Amplifier's output signal is voltage which causes power dissipation in components of simulated network (which plays reality).
Another challenge is that spectrum of music is not flat. It's more like pink noise above ca. 2 kHz. Therefore simulation with flat spectrum needs some interpretation and assumptions.
Biggish series cap for tweeter causes part of power dissipation jump at lower treble. Normally any response hump above crossover area is not a good thing. Power response simulation would help choosing final value. Fortunately this is just preliminary simulation with virtual data, and you'll have several opportunities to select more suitable values.
Well, if you're going to simulate at those frequencies (and you care about them), then the data there has to be something, right? Whether you defined it's response there or not, the driver doesn't just cease to exist there (and "undefined" does not =0). XSim always works with a frequency set across the whole band so if your data goes into lala land before getting there, XSim can only try to infer from what it's given. The assumption is you'll provide at least one data point at 20kHz or higher so it can log-interpolate. If you don't, then XSim has to either extrapolate or just use the highest frequency value you gave all the way up to 20kHz. So I went with extrapolate. If you prefer it use the last value all the way across, just edit in one extra point at say, 21kHz with same value as your highest known point. If you want it to drop to minus infinity dB there, then put that in the file.I created frd and zma data for a Volt RM3863 woofer from Volt's published curves using GraphTracer. Opening both files with Notepad confirmed the data is correct. Both load OK into Xsim but the frequency response is extended beyond the loaded data. It looks like Xsim has created an additional response curve from the cut-off at just under 5KHz. There is no data in the frd file after that cut-off.
Screenshot attached. Can anyone help?
XSim actually does a "constrained spline" curve fit to any points you give it, mapped onto its 500 point frequency values. That's so you can enter in any points you have. But insufficient information is.... insufficient. Probably no one would prefer to get a lot of error messages when frequency data doesn't cover the whole band.
Last edited:
kimmo, thanks for jumping in on the "power" question.
That impedance curve drops well below 8 ohms and the power amp source is set for 8 ohm (resistive) loads, hence "creating power", same as a 100W 8ohm power amp ideally doubles power out into 4 ohms.
That impedance curve drops well below 8 ohms and the power amp source is set for 8 ohm (resistive) loads, hence "creating power", same as a 100W 8ohm power amp ideally doubles power out into 4 ohms.
Is there any place where i can find other than default circuit blocks?
For example - Linkwitz 4 order circuit
How accurate is this program? Is there any better options for designing crossovers?
Thanks in advance
For example - Linkwitz 4 order circuit
How accurate is this program? Is there any better options for designing crossovers?
Thanks in advance
Andrew1211,
Links for XO component calculation mh-audio.nl - Crossover Networks, if you happy to register there's another one here Crossover calculator | Loudspeaker freaks.
In reality think its not the solution to use electric textbook filters, because for the first such network needs a flat impedance to look into to work accurate and therefor it would need another network that take care and linearize drivers resonance and inductance peaks, and for the second drivers have their own acoustic natural limited band pass where their stop bands often are 2nd order roll off that will add up and ruin whatever electric textbook target filter was planned at.
Notice when we talk about a textbook filter slope used for speaker building its the acoustic slope in front of speaker we talk about and printed on paper that acoustic textbook slope filter looks identical as a pure electric textbook filter with same name. So for example to reach a 4th order LR acoustic target slope one measure drivers acoustic response and impedance in situation, in situations means driver shall be mounted into the planned baffle and cavity if any and its important to have driver in situation because it performs different in free air or datasheets or when mounted onto other baffle than the intended, now feed XSim those measurements in form of a frd-file (acoustic response) plus a zma-file (impedance) and use whatever components it takes to reach whatever target curve is planned for.
It can be handy to have a real visual target curve to look at into "Frequency Response" window of XSim, use "Curves"/"Get file" there, and a way to create target curve is use free Rephase because it has most of those textbook slopes build in and set its samplerate to same as measurement chain, import Rephase impulse response into free REW and offset SPL level to same scales as in situation plus maybe center impulse response if phase for target curve should happen mean anything, now export as frd-file that XSim is happy to read via "Curves"/"Get file".
XSim looks accurate program, think most errors is get accurate acoustic measurements 🙂.
BTW take a look into "Files"/"Examples" to get inspired of how to do stuff.
Last edited:
Well said Byrtt! (as always).
About target curves, can they be generated in REW alone? I can't remember.
About target curves, can they be generated in REW alone? I can't remember.
Thanks for your replyAndrew1211,
Links for XO component calculation mh-audio.nl - Crossover Networks, if you happy to register there's another one here Crossover calculator | Loudspeaker freaks.
In reality think its not the solution to use electric textbook filters, because for the first such network needs a flat impedance to look into to work accurate and therefor it would need another network that take care and linearize drivers resonance and inductance peaks, and for the second drivers have their own acoustic natural limited band pass where their stop bands often are 2nd order roll off that will add up and ruin whatever electric textbook target filter was planned at.
Notice when we talk about a textbook filter slope used for speaker building its the acoustic slope in front of speaker we talk about and printed on paper that acoustic textbook slope filter looks identical as a pure electric textbook filter with same name. So for example to reach a 4th order LR acoustic target slope one measure drivers acoustic response and impedance in situation, in situations means driver shall be mounted into the planned baffle and cavity if any and its important to have driver in situation because it performs different in free air or datasheets or when mounted onto other baffle than the intended, now feed XSim those measurements in form of a frd-file (acoustic response) plus a zma-file (impedance) and use whatever components it takes to reach whatever target curve is planned for.
It can be handy to have a real visual target curve to look at into "Frequency Response" window of XSim, use "Curves"/"Get file" there, and a way to create target curve is use free Rephase because it has most of those textbook slopes build in and set its samplerate to same as measurement chain, import Rephase impulse response into free REW and offset SPL level to same scales as in situation plus maybe center impulse response if phase for target curve should happen mean anything, now export as frd-file that XSim is happy to read via "Curves"/"Get file".
XSim looks accurate program, think most errors is get accurate acoustic measurements 🙂.
BTW take a look into "Files"/"Examples" to get inspired of how to do stuff.
I just can’t understand why i’m getting different results with different calculators
For example i choose Linkwitz-Riley 2 order 2-way crossover for two 8 ohm speakers with cutoff frequency 800hz and i’m getting different capacitors values for the same configuration on xsim and other online calc
- Home
- Design & Build
- Software Tools
- XSim free crossover designer