All support they had at that time was a simple sliding rule.In trying to find the pretty graph showing the different alignments I found some chewy maths analysing them which might be of interest to some.
Tonearm Geometry Analysis by Graeme Dennes (c) 1983,2015 - Vinyl Engine
The diagram I was thinking of is page 25 of the linked Dennes paper (attached here )
Very impressive.
Translation into English with all the comments and comparing the different proposals side to side must also have been a hell of a job.
Hans
Unfortunately there's another elephant in the room as to a very common misunderstanding as to harmonic distortion arising from tracking angle error. AFAIK all commonly available calculators present a graph of harmonic distortion versus spindle radius as though it were independent of level: however this isn't true, and that renders most of the calulations meaningless unless the level is stated.......which it rarely is. This generally leads to fairly gross overstatement of HD arising from real programme material due to tracking error, particularly for small amplitudes. This is partly the miracle as to why and how low level programme material has very low distortion in vinyl playback and why it sounds so good despite having diabolical distortion figures if one were to believe the common calculators.
Baerwald already had it all sorted out in his 1941(?) paper, viz:
ε = νo tan(η)/rΩ
where
ε is harmonic distortion coefficient [ratio]
νo is recorded velocity [m/s]
η is angular tracking error [radians]
r is radius of arbitrary groove [m]
Ω is angular disc speed = π/30 * speed in rpm [s-1]
ε is the coefficient of interest, and multiply by 100 to get it in %.
One can readily see that ε is directly proportional to νo ie recorded velocity. And inversely proportional to disc rotation speed and spindle radius.
Note there is no recorded frequency dependency here; all that matters is the ratio of νo/rΩ, which is effectively the angle the groove makes with the tangent. For velocity sensitive cartridges that is programme level.
At -40dB ref 5cm/s, harmonic distortion works out about 0.0025% for a tracking error of 1.5 deg an outer groove at 33rpm........and that's why quiet detail can sound so good in vinyl playback.......
At high programme levels, distortion is fairly diabolical: +20dB works out about 6.25% on an inner radius groove, for example. But our hearing is far less sensitive to hd at programme peaks.........
Interesting ?
LD
Baerwald had it sorted.
Contractors were here today so some of my data was corrupted by electrical and acoustic noise, but here is some very preliminary results from the 400/4000Hz IM tests. This is just the lateral and vertical tracks at +6dB on the 400Hz tone. As usual the surfaces on these 40yr. old LP's are not the best and the frequency and amplitude of the test tones are not usually perfect.
I extracted the 4K tone's AM and FM modulation using the Hilbert transform and then converted that back into a time waveform. As expected they are dominated by the 400Hz tone, but there is an unexpected component on the AM at around 25Hz. My off the cuff explanation is this. This frequency is very close to twice the arm/cart resonance, could there be an effect at work here that does not care about the sign of the angle change? That is the amplitude of the 4k tone goes down (?) if the tracing angle is plus or minus 1 degree from ideal or something like that. Lucky?
I also suppose the phase relationship between the 400Hz tone and the sidebands also has information. I think I can do that.
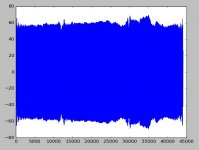
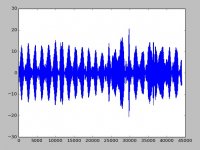
The scale here is referred to 3985 or so on the frequency and 750-800 codes on the amplitude, the plots being labeled LSB's in the vertical and no. of samples horizontal.
1 - Lateral +6dB FM
2 - Lateral +6dB AM
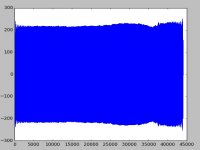
3 - Vertical +6dB FM
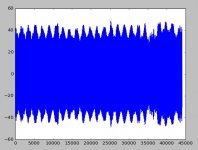
4 - Vertical +6dB AM
EDIT - Yes, on the +18db track the stylus leaves the groove surface but only has a few warp assisted jumps at +15dB
I extracted the 4K tone's AM and FM modulation using the Hilbert transform and then converted that back into a time waveform. As expected they are dominated by the 400Hz tone, but there is an unexpected component on the AM at around 25Hz. My off the cuff explanation is this. This frequency is very close to twice the arm/cart resonance, could there be an effect at work here that does not care about the sign of the angle change? That is the amplitude of the 4k tone goes down (?) if the tracing angle is plus or minus 1 degree from ideal or something like that. Lucky?
I also suppose the phase relationship between the 400Hz tone and the sidebands also has information. I think I can do that.
The scale here is referred to 3985 or so on the frequency and 750-800 codes on the amplitude, the plots being labeled LSB's in the vertical and no. of samples horizontal.
1 - Lateral +6dB FM
2 - Lateral +6dB AM
3 - Vertical +6dB FM
4 - Vertical +6dB AM
EDIT - Yes, on the +18db track the stylus leaves the groove surface but only has a few warp assisted jumps at +15dB
Attachments
Last edited:
I finally read through the patent myself. There is a discrepancy because both 15 and 16.5 degrees are mentioned I must be missing a fine point. I also see that we want the component inphase with the 400Hz modulation and reject the quadrature component (tracing distortion). I figure that unless we have the means to real time tune VTA I don't see that more than a short clean set of cycles are needed to get the amplitude and phase relationships.
Another fine point is that the patent mentions equalization of the input but I don't know if this one of the RIAA equalized LP's (in any case the maths of this re: the FM/AM sidebands is making my head explode right now).
So here is another look at the data, vertical 6dB only but left and right channels. the plots are right channel on top with the 400Hz FM of the 4k on the left in Hz deviation and the 400Hz signal magnitude on the right in LSB's. The left and right are opposite phase as they should be and the FM component is in phase as I would expect.
I was thinking of stacking a trash LP under my mat and repeating this test, simple geometry should get the change of VTA (if it's too gross I could use some card stock). Isn't this enough data to see the groove alignment?
Attachments

I have to admit, I do not know what you are doing, Scott. 🙂 But let's hope Lucky or someone else does.
Can you post clips of this? I'd love to look at them. And if you do your shim trick those clips would be nice to compare.
Can you post clips of this? I'd love to look at them. And if you do your shim trick those clips would be nice to compare.
I have to admit, I do not know what you are doing
Sorry about that. The test track has a low level 4k tone mixed with a large 400Hz tone. The idea is that if the pickup perfectly traced the cutter's path there would be no FM on the 4k tone. The angle error causes alternately faster or slower motion relative to the groove wall at 400Hz (i.e. FM of the 4k tone at 400Hz).
A vertical groove cut is left-minus right so the channels are out of phase but the FM can't be because the two sides of the stylus can't have any relative motion (of note). All the data in the plots is at 400Hz, about 110 samples at 44100.
Last edited:
So where does this put us on linear tracking arm benefits ? Can we say difference is minute with respect to distortion ?Note there is no recorded frequency dependency here; all that matters is the ratio of νo/rΩ, which is effectively the angle the groove makes with the tangent. For velocity sensitive cartridges that is programme level.
At -40dB ref 5cm/s, harmonic distortion works out about 0.0025% for a tracking error of 1.5 deg an outer groove at 33rpm........and that's why quiet detail can sound so good in vinyl playback.......
At high programme levels, distortion is fairly diabolical: +20dB works out about 6.25% on an inner radius groove, for example. But our hearing is far less sensitive to hd at programme peaks.........
Interesting ?
Thanks and regards.
We can say harmonic distortion difference is generally far smaller for real programme material than published graphs typically portray. Particularly for low level programme material.So where does this put us on linear tracking arm benefits ? Can we say difference is minute with respect to distortion ?
Thanks and regards.
However, there's also the matter of mechanical stylus alignment for non-spherical profiles, potentially affecting stylus-groove contact mechanics (eg friction) and L:R contact locations incurring small time errors.
It's generally a good idea to ensure excellent tracking angle alignment: but not for the reasons common wisdom would have us believe, IMO.
LD
I surrender for now, I removed the pad (~.14") and then added 2 LP's under everything and the results are almost imperceptibly different for all three conditions. This is both on HD and the FM test.
Thanks anyway, Scott. If you'd kindly post the before/after recorded files, I'd like to take an look please? ThxI surrender for now
LD
Last edited:

OK will do, after a little trimming so they are not huge.Thanks anyway, Scott. If you'd kindly post the before/after recorded files, I'd like to take an look please? Thx
LD
See if this works, it's all three vertical IM bands for normal, raised, and lowered.
Dropbox - IM_test_files.zip
Dropbox - IM_test_files.zip
The pad is 0.14" and the arm from pivot to stylus is 8.5" more or less, I didn't measure the 2 LP's but it's close to the pad. I get +-1 degree or so?
EDIT - Both the original CBS STR 112 liner notes and the test we are trying to do indicate an inch or more would be needed, this can't be right.
EDIT - Both the original CBS STR 112 liner notes and the test we are trying to do indicate an inch or more would be needed, this can't be right.
Last edited:
I'll try to verify the angle, is no one else does.
So far I do see some differences between the files. Will try to get them into a graphic format for posting.
So far I do see some differences between the files. Will try to get them into a graphic format for posting.
Unfortunately this LP has a warp across most of it in one spot, it's easy to see but does not mess up the data much. The AM on the first test of each has the mystery 25Hz ripple. There seems to be a similar slight magnitude change in the AM tests too.
EDIT - If I plot the AM spectra next to each other there is a visible trend toward raising the LP as an improvement.
EDIT - If I plot the AM spectra next to each other there is a visible trend toward raising the LP as an improvement.
Last edited:
Well I was just about to say that. 🙂 I find that HIGH has tighter peaks on the fundamental and all the harmonics than either LOW or NORMAL. That could well be the AM you are seeing.
I surrender for now, I removed the pad (~.14") and then added 2 LP's under everything and the results are almost imperceptibly different for all three conditions. This is both on HD and the FM test.
Hi Scott
What is the profile of the needle you use?
Spherical - conical are the least sensitive to VTA change. Then elliptical, then super elliptical, then the line contact profiles which will show the most pronounced effects.
George
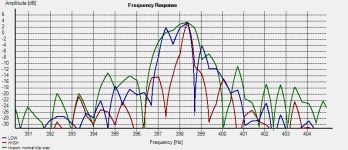
Here are the 3 files compared in two different ways. There is an FFT that should animate thru High, Normal, Low and then a zoom in that shows the spread at 400Hz and at 4K.
That's a start. I'll look at them in some different ways to see if more info can be tweaked out.
That's a start. I'll look at them in some different ways to see if more info can be tweaked out.
Attachments


- Home
- Source & Line
- Analogue Source
- Test LP group buy