Guys up for plotting a oscilloscope function view?
Hello JensH, Demian and All.
Looking back over the near 1,100 posts to this thread all the audio analyzer output plots are FFT’s. With the advantage of large sample size and averaging over many samples, anything that is not periodic is completely removed from our view. What remains, barley popping up out of the “noise floor” is a few feeble harmonics that in real time are consumed by real time noise. What we are speaking of are the limits of detection of the hardware and well within the limits of the hardware specification.
Looking today at the Audio Tester manual Audio Tester has an oscilloscope function with time on the X axis of the plot, real time without averaging to remove the random things, like noise. Are either of you guys up for plotting a oscilloscope function view with time scaled to show the -115dB harmonics? I bet that we see noise that will put the low level harmonics in perceptive.
DT
I wonder if the software scope function have capability to adjust sync timing adjustment like on the analog scope. Any scaling to lower level is great. I would assume we want to have scope functions that not only include the benefits of analog scopes, but also add the benefits of digital processing as well.
Sent from my iPhone using Tapatalk
Sent from my iPhone using Tapatalk
I wonder if the software scope function have capability to adjust sync timing adjustment like on the analog scope. Any scaling to lower level is great. I would assume we want to have scope functions that not only include the benefits of analog scopes, but also add the benefits of digital processing as well.
Sent from my iPhone using Tapatalk
Hello,
It has been years since I had my hands on an analog scope. Oscilloscopes do have an analog feel to them, however the scope on my bench is digital to the bone.
The point is that Audio Tester V3.0 audio Analyzer software has a oscilloscope function (plus other functions).
I would like to see how the other functions, besides FFT, work with JensH’s Audio Analyzer. I can see some possible advantages. This analyzer is 24bit as most scopes are only 8bit.
DT
I think all my scopes are real old analog. I assume that CRT based scopes are analog. I don't use software scope often, only sometimes on SoundEasy. What I would like to find out is how digital scopes will sync with the input, especially when looking at low level signals. On the analog scope, you have to manually adjust the sync to get the signal to stand still, this is kind of tricky when you have a mixture of signals.
A 24 bit scope is meaningless for waveforms. your display has maybe 12 bits of vertical resolution if its a 4K X 2K display. There really is nothing to see in the time domain. However in the frequency domain there is lots to see if the vertical is log (dB).
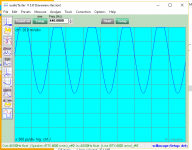
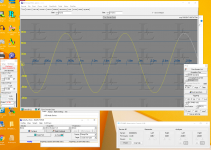
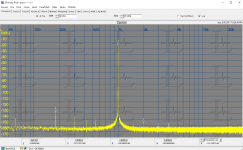
Three pictures below. First Audiotester scope. I still have a lot to learn to get around Audiotester's controls so I switched to Praxis scope. You can see the trigger options. Not as sophisticated as a real scope today but good enough. The waveform is flawless and you can't see evidence of the hum in the image. Third image is the spectrum of the same source (Victor oscillator on batteries directly to the differential input with a separate ground connection to the chassis). Here you can see the hum and the hint of harmonic at HD2 (-131 dB) and the hum at -113 dB. The hum is probably the unshielded cable between the oscillator and the XLR input combined with the 600 Ohm source impedance of the Victor. Its too late tonight to work up a better interface scheme. in the past i have put the whole oscillator package (in a cast aluminum box) inside a second isolated metal box acting as a shield. Its really clumsy and I need to find a better box than an old Zero suitcase.
Three pictures below. First Audiotester scope. I still have a lot to learn to get around Audiotester's controls so I switched to Praxis scope. You can see the trigger options. Not as sophisticated as a real scope today but good enough. The waveform is flawless and you can't see evidence of the hum in the image. Third image is the spectrum of the same source (Victor oscillator on batteries directly to the differential input with a separate ground connection to the chassis). Here you can see the hum and the hint of harmonic at HD2 (-131 dB) and the hum at -113 dB. The hum is probably the unshielded cable between the oscillator and the XLR input combined with the 600 Ohm source impedance of the Victor. Its too late tonight to work up a better interface scheme. in the past i have put the whole oscillator package (in a cast aluminum box) inside a second isolated metal box acting as a shield. Its really clumsy and I need to find a better box than an old Zero suitcase.
Attachments
Well, it wouldn't of course. I was just speculating that certain sources of internal crosstalk may couple in a way that would be suppressed, and other sources may not be.
Anyway, there is perhaps a more straight forward explanation.
It could be that the hum seen at the odd harmonics are a result of nonlinear functions, e.g. the characteristics of the rectifier diodes in the power supply. This will lead to pulse currents during the charging of the large capacitors of the power supply.
In principle similar to figure 6 here:
http://www.edn.com/Home/PrintView?contentItemId=4422710
I just made a spectrum of a 50 Hz triangle signal. Not quite the same signal as the charge pulse currents, but it was easy to generate with audioTester. This also shows a lot of odd harmonics content and no even harmonics.
The exact source(s) and coupling mechanism(s) are still not investigated, but I think that the levels are low enough for all practical purposes.
Jens, a symmetrical wave like a triangle can be expected to show odd harmonics only. A good approximation of the waveform at the output of a rectifier is a sawtooth shape with the falling part about 80% of the total. If you look at such a wave you do see a mix of odds and evens. The proportion depends among other things of the 'rounding' of the sawtooth 'teeth' which again depends on the rectifier-reservoir caps values and current drawn.
Jan
A 24 bit scope is meaningless for waveforms. your display has maybe 12 bits of vertical resolution if its a 4K X 2K display. There really is nothing to see in the time domain. However in the frequency domain there is lots to see if the vertical is log (dB).
Three pictures below. First Audiotester scope. I still have a lot to learn to get around Audiotester's controls so I switched to Praxis scope. You can see the trigger options. Not as sophisticated as a real scope today but good enough. The waveform is flawless and you can't see evidence of the hum in the image. Third image is the spectrum of the same source (Victor oscillator on batteries directly to the differential input with a separate ground connection to the chassis). Here you can see the hum and the hint of harmonic at HD2 (-131 dB) and the hum at -113 dB. The hum is probably the unshielded cable between the oscillator and the XLR input combined with the 600 Ohm source impedance of the Victor. Its too late tonight to work up a better interface scheme. in the past i have put the whole oscillator package (in a cast aluminum box) inside a second isolated metal box acting as a shield. Its really clumsy and I need to find a better box than an old Zero suitcase.
The purpose of time scale and voltage scaling is to scale the signal to the limited screen. This is available on any scope.
Looking at the harmonics vs looking at the signal real time can give you a totally different perspective. Looking at signal gives you a more direct perspective when troubleshooting whereas the harmonics is good for spec control.
Sent from my iPhone using Tapatalk
Jan,
Yes, if you look at the voltage after the rectifier.
If you look at the current in the transformer, it looks pretty much like the figure 6 that i referred to in the previous post.
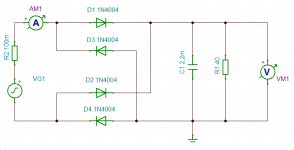
I just made a simulation of a rectifier circuit as shown attached. The brown curve is the output voltage, the green curve in the current in the generator (transformer).
The peak voltage of the sine generator is 20V in the simulation.
soongsc,
I agree that the scope function can be used for trouble shooting. If no oscilloscope is available, it can be used to show e.g. clipping or nonlinearity, which could be caused by e.g. a low supply voltage or incorrect DC bias voltages.
I haven't really used the scope function in audioTester, only briefly checked it, since I have an oscilloscope and prefer to use that. It is of course much better for showing instability at high frequencies (MHz), which the Audio Analyzer would not be able to measure.
Yes, if you look at the voltage after the rectifier.
If you look at the current in the transformer, it looks pretty much like the figure 6 that i referred to in the previous post.
I just made a simulation of a rectifier circuit as shown attached. The brown curve is the output voltage, the green curve in the current in the generator (transformer).
The peak voltage of the sine generator is 20V in the simulation.
soongsc,
I agree that the scope function can be used for trouble shooting. If no oscilloscope is available, it can be used to show e.g. clipping or nonlinearity, which could be caused by e.g. a low supply voltage or incorrect DC bias voltages.
I haven't really used the scope function in audioTester, only briefly checked it, since I have an oscilloscope and prefer to use that. It is of course much better for showing instability at high frequencies (MHz), which the Audio Analyzer would not be able to measure.
Attachments

Okay then
A test for that could be devised: supply DC power from a SLA or LiIon or LiFe battery and investigate the residual noise spectra.
IF there exists the same odd-only pattern, then a postulate that the measurement device's signal chain is deferentially treating even/odd harmonics would be supported.
IF there exists a more uniform (monotonically decreasing?) harmonic pattern, then the postulate would not be supported... and one might well wish to investigate the onboard PS further.
IF the residual noise spectra is obscured by the noise floor... then we only learn that the battery option is advantageous and, sadly, nothing about the measurement device's signal chain treatment of DUT harmonics.
Anyway, there is perhaps a more straight forward explanation.
It could be that the hum seen at the odd harmonics are a result of nonlinear functions, e.g. the characteristics of the rectifier diodes in the power supply. This will lead to pulse currents during the charging of the large capacitors of the power supply.
A test for that could be devised: supply DC power from a SLA or LiIon or LiFe battery and investigate the residual noise spectra.
IF there exists the same odd-only pattern, then a postulate that the measurement device's signal chain is deferentially treating even/odd harmonics would be supported.
IF there exists a more uniform (monotonically decreasing?) harmonic pattern, then the postulate would not be supported... and one might well wish to investigate the onboard PS further.
IF the residual noise spectra is obscured by the noise floor... then we only learn that the battery option is advantageous and, sadly, nothing about the measurement device's signal chain treatment of DUT harmonics.
I'm hard pressed to come up with a mechanism where even order harmonics are suppressed independent of frequency. There are ways that can add harmonics but I have seen no evidence of added harmonics beyond the residuals of the ADC.
Battery power would require 3 battery setups to provide the 5V & +/- 15v. Then feeding the regulators. Its pretty involved.
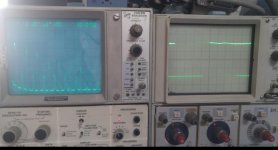
FWIW here is the filed from the supply in the RTX. First is an improvised pickup (old air core crossover part) second is the field with the coil located as in the picture and third is with it a good distance away. Sorry about the glare from the window but you can still see the spectrum of the supply with its odd harmonic mix.
I have no idea of the strength of the field. I can't find any of my calibrated probes.
Battery power would require 3 battery setups to provide the 5V & +/- 15v. Then feeding the regulators. Its pretty involved.
FWIW here is the filed from the supply in the RTX. First is an improvised pickup (old air core crossover part) second is the field with the coil located as in the picture and third is with it a good distance away. Sorry about the glare from the window but you can still see the spectrum of the supply with its odd harmonic mix.
I have no idea of the strength of the field. I can't find any of my calibrated probes.
Attachments


Last edited:
I'm hard pressed to come up with a mechanism where even order harmonics are suppressed independent of frequency.
Maybe this post from JoannesPaulus at EDABoard.com would be helpful...
JoannesPaulus said:Re: harmonics in balanced circuits
I'll give you a hint:
The differential signal is:
yp = x+ax^2+bx^3
ym =-x+a(-x)^2+b(-x)^3 = -x+ax^2-bx^3
where yp and ym are the positive and negative signals.
For the differential signal:
yd = yp-yp = x+ax^2+bx^3 - (-x+ax^2-bx^3)
= x+ax^2+bx^3+x-ax^2+bx^3
= 2(x+bx^3)
For the common mode signal:
yc = (yp+ym)/2 = ax^2
I think Jan Didden has a solution for that ...Just one 6V battery can get you all three rails - not sure what the current requirements are, but Jan can help with that I'm sure. 🙂Battery power would require 3 battery setups to provide the 5V & +/- 15v. Then feeding the regulators. Its pretty involved.
I still don't see what you are trying to point out. And I still have not seen a suppression of even harmonics in a circuit.
What the link suggests is that no even harmonics will propagate through a balanced circuit. However I think its referring to is CM to DM conversion or maybe harmonic generation in the circuit. And I think that's only true when the circuits are perfectly balanced.
I followed the link harmonics in balanced circuits and still don't really know what they are discussing. Hopefully someone smarter can explain further.
If the differential aspect is an issue there are few options some all the premium ADC's are differential. I think the QA400 has a single ended CODEC but its performance falls short of this league. Or you can get a Shibasoku 725 which is single ended.
The power consumption of the RTX6001 is relatively high. It was not designed for battery operation. The primary target was high performance.
Jan's power supply is not powerful enough. I already briefly looked at that together with Jan.
Could it be supplied from a batteries? Yes, of course it could, if the batteries were large enough.
Would it make sense? Probably not. If you supply it from switched mode power supply there is a risk of creating more problems than you solve.
And is there a real problem to solve? In my opinion, no. In many cases the hum will be dominated by the test setup anyway, since the level of the hum is very low already.
And the production of the RTX6001 is already progressing, so there will be no design changes short term.
Battery power would require 3 battery setups to provide the 5V & +/- 15v. Then feeding the regulators. Its pretty involved..
Demian (or Jens) can you disclose what the current requirements are for these supplies? If not, possibly by PM for personal use?
Jan
dive deep
Hello,
I believe that it is too soon to dismiss a “24 bit” oscilloscope as being meaningless for waveforms.
What is the 12 bits of vertical resolution about? You are looking at the same monitor that you view the 24 bit FFT’s function. Something is lost in the logic.
Take a look at the AP SYS-2722, in addition to digital monitor outputs there analog signal monitor outputs. The analog monitor outputs are minus the fundamental test frequency, everything else remains. Think notch filter.
With the fundamental test frequency notched out you can take a gnat’s eyebrow view of the remaining distortion and noise waveform. Using the oscilloscope function you can dive deep into those 24 bits and display the results on you 12 bit display.
DT
A 24 bit scope is meaningless for waveforms. your display has maybe 12 bits of vertical resolution if its a 4K X 2K display. There really is nothing to see in the time domain. However in the frequency domain there is lots to see if the vertical is log (dB).
snip
Hello,
I believe that it is too soon to dismiss a “24 bit” oscilloscope as being meaningless for waveforms.
What is the 12 bits of vertical resolution about? You are looking at the same monitor that you view the 24 bit FFT’s function. Something is lost in the logic.
Take a look at the AP SYS-2722, in addition to digital monitor outputs there analog signal monitor outputs. The analog monitor outputs are minus the fundamental test frequency, everything else remains. Think notch filter.
With the fundamental test frequency notched out you can take a gnat’s eyebrow view of the remaining distortion and noise waveform. Using the oscilloscope function you can dive deep into those 24 bits and display the results on you 12 bit display.
DT
Jens can provide the details but it is drawing 19 Watts which seems a little beyond what the silent switcher is capable of.
19 watts of consumption is a pretty healthy appetite. Personally, I'm happy to hear it won't run on batteries as low noise performance usually means higher currents. (within reason of course)
-Chris
-Chris
Hi Jan,
I sent you that information in a PM on January 15. 🙂
Must have been Alzheimer-Light.... ;-)
I'll look it up.
Jan
Hello,
I believe that it is too soon to dismiss a “24 bit” oscilloscope as being meaningless for waveforms.
What is the 12 bits of vertical resolution about? You are looking at the same monitor that you view the 24 bit FFT’s function. Something is lost in the logic.
Take a look at the AP SYS-2722, in addition to digital monitor outputs there analog signal monitor outputs. The analog monitor outputs are minus the fundamental test frequency, everything else remains. Think notch filter.
With the fundamental test frequency notched out you can take a gnat’s eyebrow view of the remaining distortion and noise waveform. Using the oscilloscope function you can dive deep into those 24 bits and display the results on you 12 bit display.
DT
Now I understand what you are asking. If you want to look at low level details after notching you are looking much deeper. Post notch is a specific capability that could be done through DSP and has use if you can get a phase relationship to the fundamental waveform to figure out the causes. This works until the distortion is close to the test system's residuals. Its a feature I use occasionally with the analog analyzers. Doing a notch digitally has a lot of benefits.
- Home
- Design & Build
- Equipment & Tools
- DIY Audio Analyzer with AK5397/AK5394A and AK4490