Hi wesayso looks for me we see and say the same thing.
Jack think its complicated area try look down -40dB all three drivers is summing there mid looks like kind of filler driver, to sum smooth that area and not have any peaks and dips all three needs prescription for own slope and precise timing.
I was just going to say that you were both saying the same so you are both equally wrong, ....................or right, for that matter
BRYTT kindly provided the ideal curves.
Here is what I measured at 1m:
Here they are overlayed:
We can all see that I didn't match the theoretical target FR or phase perfectly. My FR wasn't as good, my phase response has less phase rotation.
My feeling is the XO is good enough; I have worse things to worry about. BRYTT's curve is a sanity check, not the goal.
I actually have some data with different DSP delays for the CD.
with CD delay = 2.35 ms
with CD delay = 2.38 ms
I noted the difference, thought it was small, and moved on to measuring at the LP and then listening instead of finding the delay that minimizes the height of that small bump in the GDR. The AFRs from those two measurements are within a fraction of a dB of identical.
Yes the data (small difference in GDR bump) shows that my XO timing isn't optimal, so I accept your criticism, up to a point.
My point has been that the dip in the post equalization AFR at the LP is NOT due to the XO timing. At first it sounded like that is what was being said and that I still disagree with. I think that dip is due to TDA_EQ averaging out the measurements across my roughly 2' square measurement window, within which several dB of variation can be seen (in the all AFRs chart).
Attachments
the thing I skipped over further crossover optimization to see is how well TDA EQ did out at the LP.
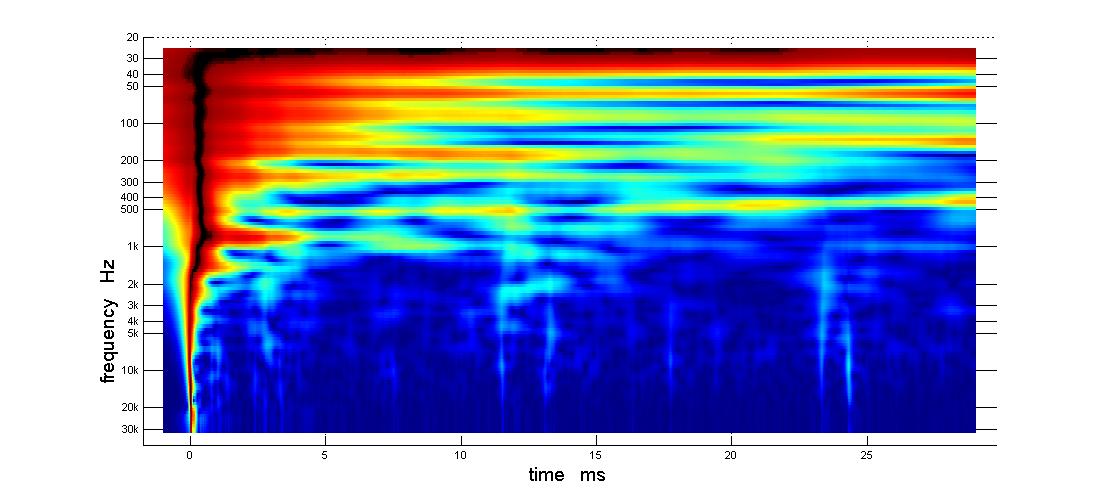
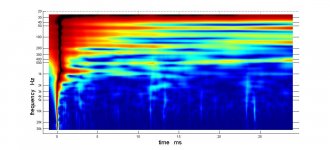
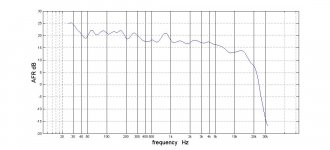
Here is the post-equalization TDA pl at LP. This is a single point measurement. Note how straight the direct response line is and also how much room effect is present as evinced by the horizontal red/orange/yellow streaks.
Here is the corresponding AFR. It again is a single point measurement and actually has a peak near where the multi-point AFRe has a dip
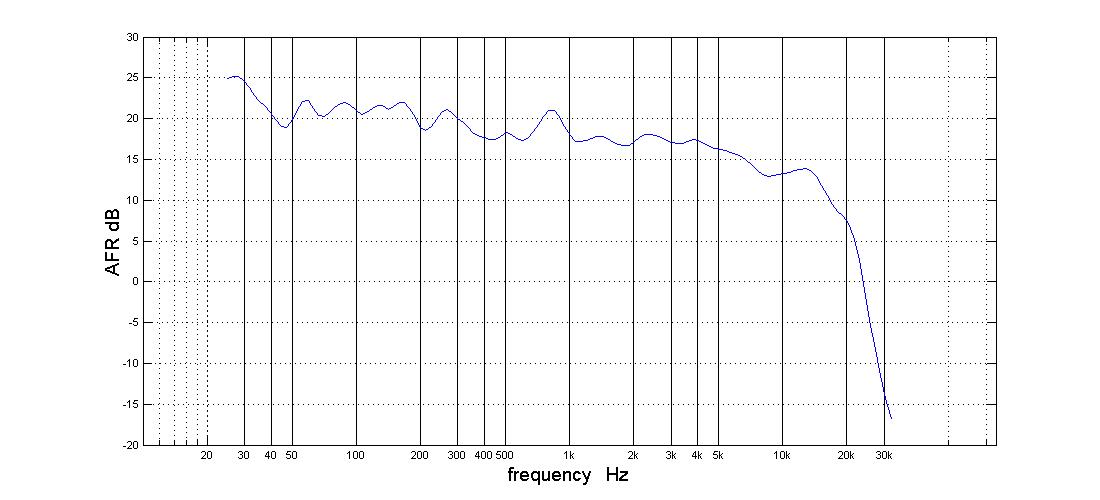
So how did it do? I think it did well given the prominence of the room. The room is indeed prominent, given the difference between the 1m and the at LP measurements. There is considerable room for improvement but the way to get there is with room treatments and/or higher horn directivity.
Here is the post-equalization TDA pl at LP. This is a single point measurement. Note how straight the direct response line is and also how much room effect is present as evinced by the horizontal red/orange/yellow streaks.
Here is the corresponding AFR. It again is a single point measurement and actually has a peak near where the multi-point AFRe has a dip
So how did it do? I think it did well given the prominence of the room. The room is indeed prominent, given the difference between the 1m and the at LP measurements. There is considerable room for improvement but the way to get there is with room treatments and/or higher horn directivity.
Attachments
...so I accept your criticism...
Makes me think of myself maybe not being polite, will say that has never been meaning here, posts has all been enthusiasm driven and also because sometimes we directly asked for answers and suggestions in some posts down the road.
Admit there's possibility that too much room reflections is present in some measurements so my own decodes is wrong based, also not 100% shure about actual DSP other that sense its miniDSP and think of it as setup with IIR LR4 XO points at 350Hz/950Hz. Have no actual knowledge if TDA_EQ is loaded via VST plugin or APL hardware and if any FIR filters is loaded to miniDSP device to linearize phase for XO points which would change situation.
This is post 267 data at 1 meter and while it looks more ala textbook target at closer look can still see bit hard transition between CD to mid as wesayso points out and also mid shall show steady increase not that strait vertical line, think at 1 meter if slopes/levels/acoustic center is trimmed precise APL software will show textbook black ridge at least down to say 200Hz area and get that inline will probably help overall in the various room measurements.
This is also from post 267 at 1 meter but with post EQ, that strait vertical black ridge line think is unexpected.
Sorry, poor choice of words on my part if you thought that.
This is too confusing - too much data. Compare the direct response lines in post eq pl at 1m with the post eq pl at the LP in my post #302. They are different. The bend at 1 Khz appears more gradual in the more distant measurement.
What accounts for that? What I learned doing the review is that early reflections where TDA can't separate the direct from reflected response, change the apparent timing. That would say that the larger group delay in the 1m measurement is more accurate. OTOH, if TDA can't separate the direct and reflected, neither can our ears, so the measurement at the LP may be more representative of what I'm hearing.
Jack
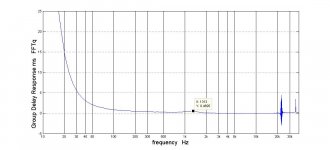
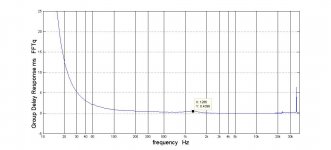
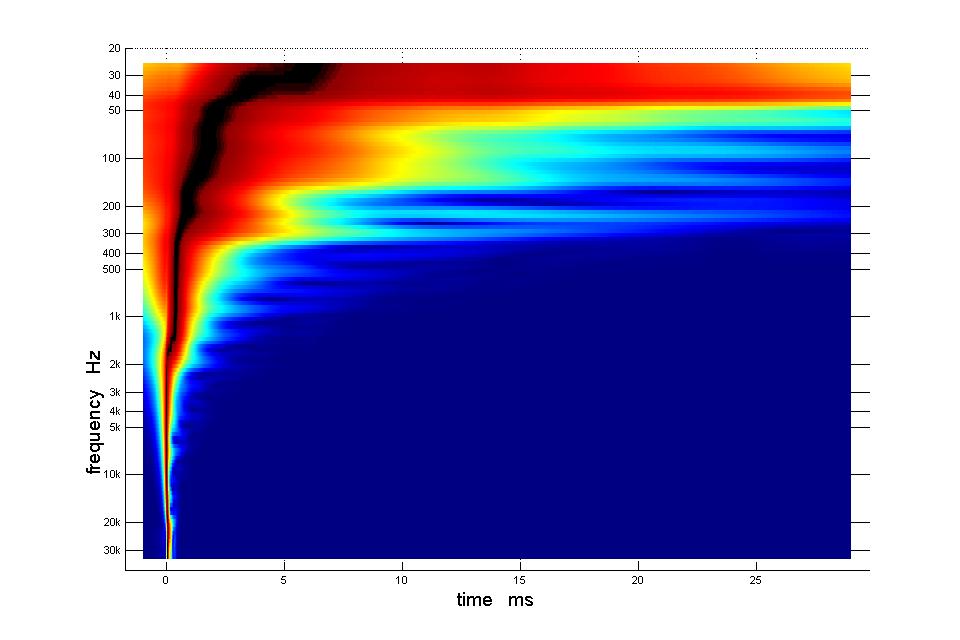
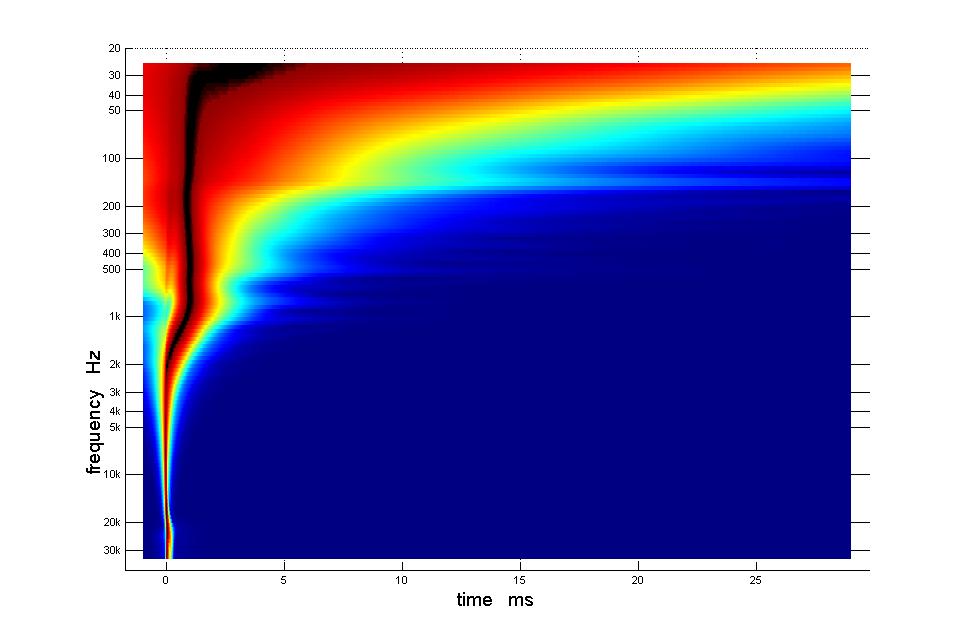
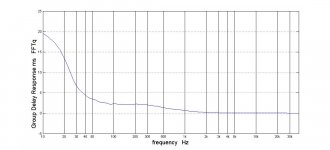
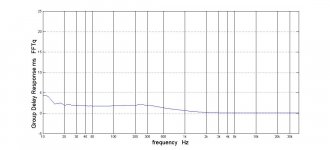
Let's compare the GDR of the reference to the speaker's delay curve.
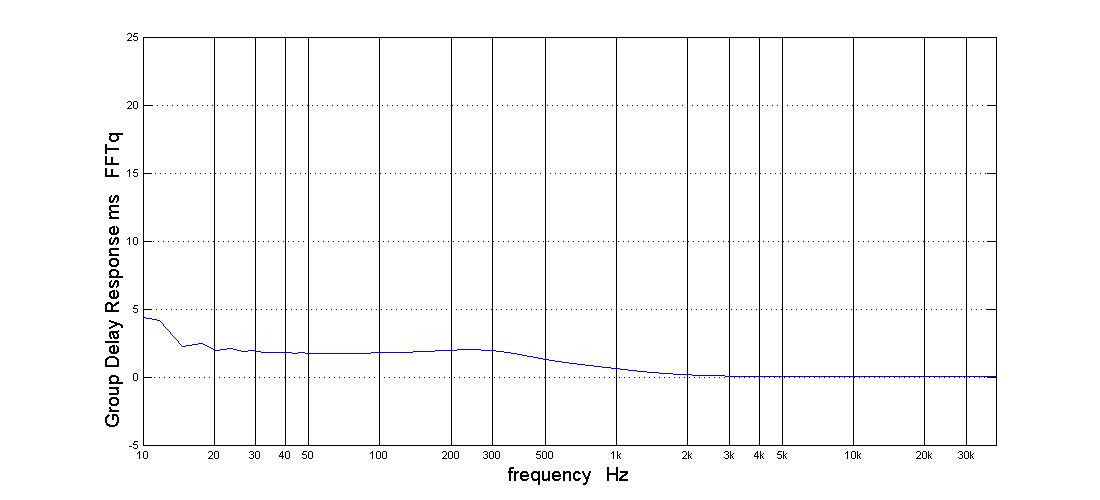
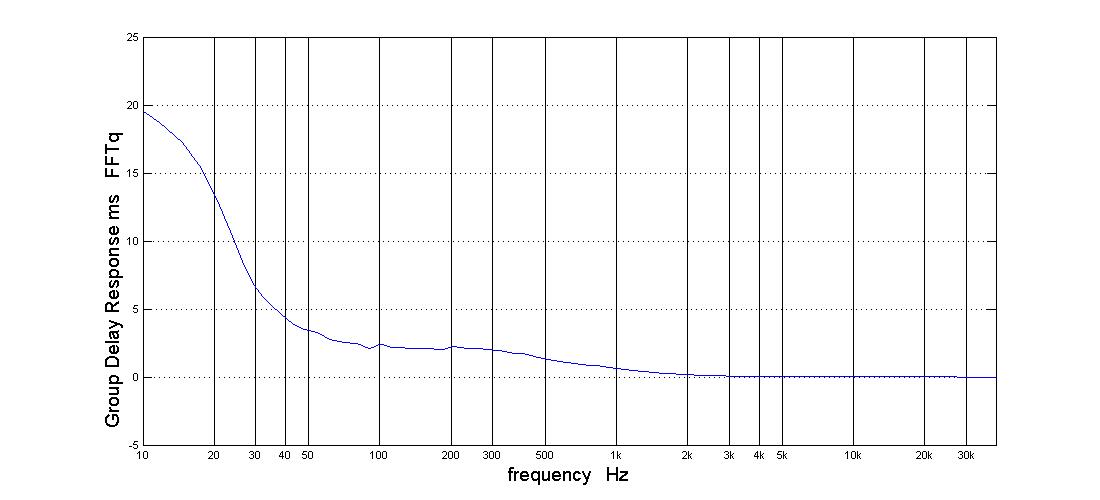
Two GDRs generated by importing BRYTT's reference IR into TDA
this one with min phase subtracted
this one with min phase included
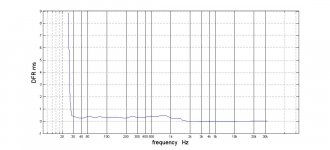
and, for ease of comparison, the speaker's DFR at the LP FIR ON
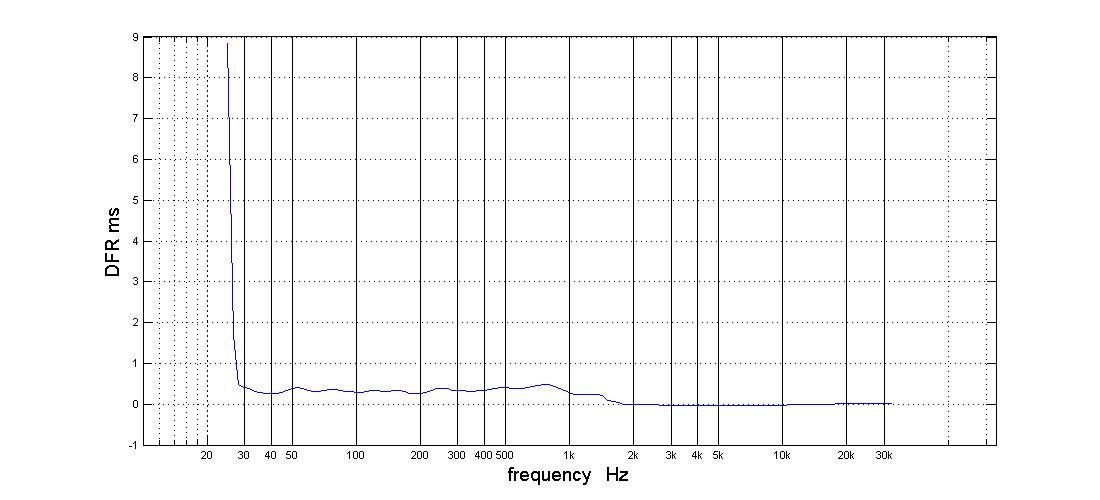
Strangely, while the speaker's DFR looks very much like the reference's GDR , its GDR does not.
Without min phase included, its "noisy"
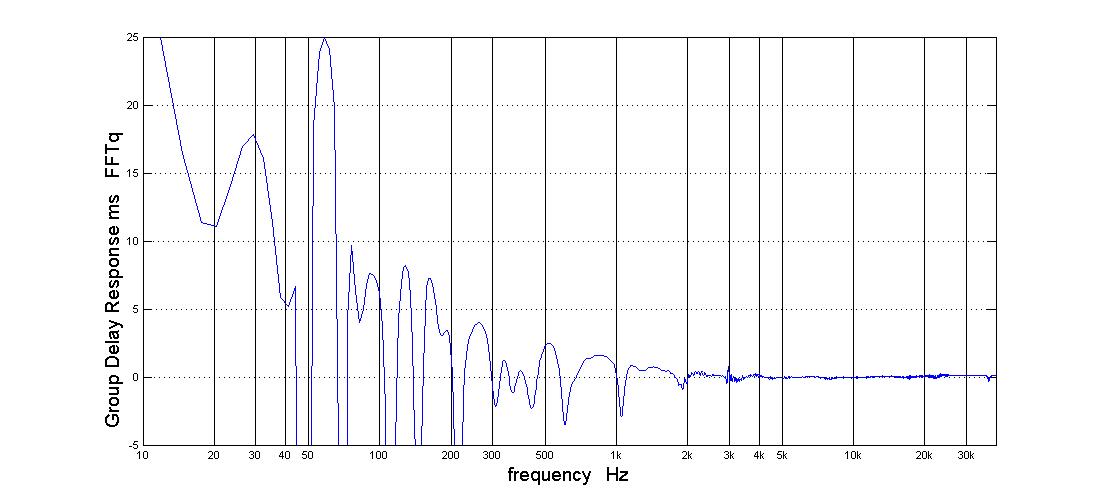
with min phase subtracted its cleaner but different .
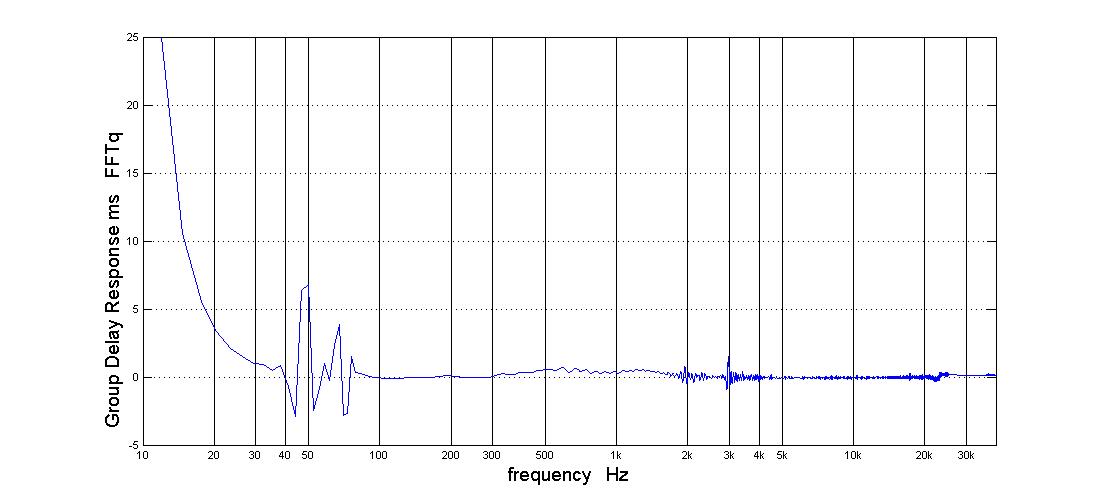
I don't know what to think of that but I'm sure its not a coincidence that the measured DFR at the LP is close to the GDR of the reference curve.
Two GDRs generated by importing BRYTT's reference IR into TDA
this one with min phase subtracted
this one with min phase included
and, for ease of comparison, the speaker's DFR at the LP FIR ON
Strangely, while the speaker's DFR looks very much like the reference's GDR , its GDR does not.
Without min phase included, its "noisy"
with min phase subtracted its cleaner but different .
I don't know what to think of that but I'm sure its not a coincidence that the measured DFR at the LP is close to the GDR of the reference curve.
Attachments
-
 GDR of BRYTTs IR min phase included.jpg51.9 KB · Views: 394
 -
 GDR of BRYTTs IR min phase subtracted.jpg51.3 KB · Views: 402
 -
 TDA DFR measured ctr couch forward 2 ft with FIR ON.jpg69.7 KB · Views: 415
 -
 GDR min phase included center couch forward FIR ON.jpg60.4 KB · Views: 393
 -
 GDR min phase subtracted center couch forward FIR ON.jpg54.6 KB · Views: 414
Last edited:
as a Star Trek fan, there was something about nc535 that stuck in my head
i finally found an image that makes sense of the "nc535" moniker.
sorry for the off topic!

as a Star Trek fan, there was something about nc535 that stuck in my head
i finally found an image that makes sense of the "nc535" moniker.
sorry for the off topic!
well that's a lot better than what I got googling:
Attachments

oh ok i'll go back to following along quietly, i've learned a lot that i can hopefully apply to a future build.
Let's compare the GDR of the reference to the speaker's delay curve.
Two GDRs generated by importing BRYTT's reference IR into TDA
this one with min phase subtracted
this one with min phase included
and, for ease of comparison, the speaker's DFR at the LP FIR ON
Strangely, while the speaker's DFR looks very much like the reference's GDR , its GDR does not.
Your feedback from Rainmonds was:
The source of DFR is black edge of TDA 3D/pl graphs - It is clearly time.
Exactly those black edges is what looks not by the book when XO point at 350Hz is of IIR type, if its clearly time why then not try change it a bit, it takes 10 seconds edit in miniDSP and 10 seconds change it back : )
There is signs woofer needs delayed 2mS-2,5mS relative to mid and also it looks mid little too much delayed relative to tweeter but suggest try first delay woofer 2,0mS and measure what happens.
That said think you never answered, is XO points at 350HZ/950Hz good old IIR or is it modern FIR, sense its good old IIR and therefor the flat phase between two lowest band-pass that looks like flat phase FIR is wrong and cause is probably woofer acoustic center fire too early relative to mid.
Without min phase included, its "noisy"
with min phase subtracted its cleaner but different .
I don't know what to think of that but I'm sure its not a coincidence that the measured DFR at the LP is close to the GDR of the reference curve.
Guess it noisy because while amplitude sum okay acoustic centers are a bit out of sync and show up in time based curves.
Last edited:
Made analytic DSP test and summed the 3x pass-bands, test was electric real world DSP DAC output to DSP ADC input and APL_TDA listening in loop, result was exactly same as the synthetic one made in Rephase. Its the upper one below and after that run a bunch of test with different settings and when woofer had polarity reversed plus bit of too much delay for mid and tweeter plus a steeper slope between mid and tweeter then APL_TDA starts to show lower curve below. Don't say this is what happens but could be a clue to check IR for each of three band-pass is same upward positive polarity, maybe recheck precision for acoustic slopes and recheck acoustic center timing. Give a word it if you like uploaded synthetic target curves for each particular band-pass and can also make mixes with W+M and M+T to use as quality control.


Attachments

Hi BRYTT:
I appreciate all you are doing to help me get this right.
I'm going to take another look at the CD/mid XO. I think your second curve shows a bigger delay change around 1 Khz than I measure but the shape is right.
I don't think you are modelling the group delay of my woofer in these diagrams. I don't think there is an easy way to do it other than by simulating - because there is a horn path involved as well as a sealed box. That could be why we disagree about the woofer timing. Without the horn path, the DSP delay I would have on the mids would correspond to at most a few inched of path length delta.
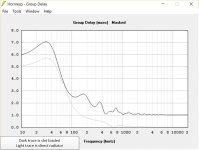
Here is the graph from hornResp
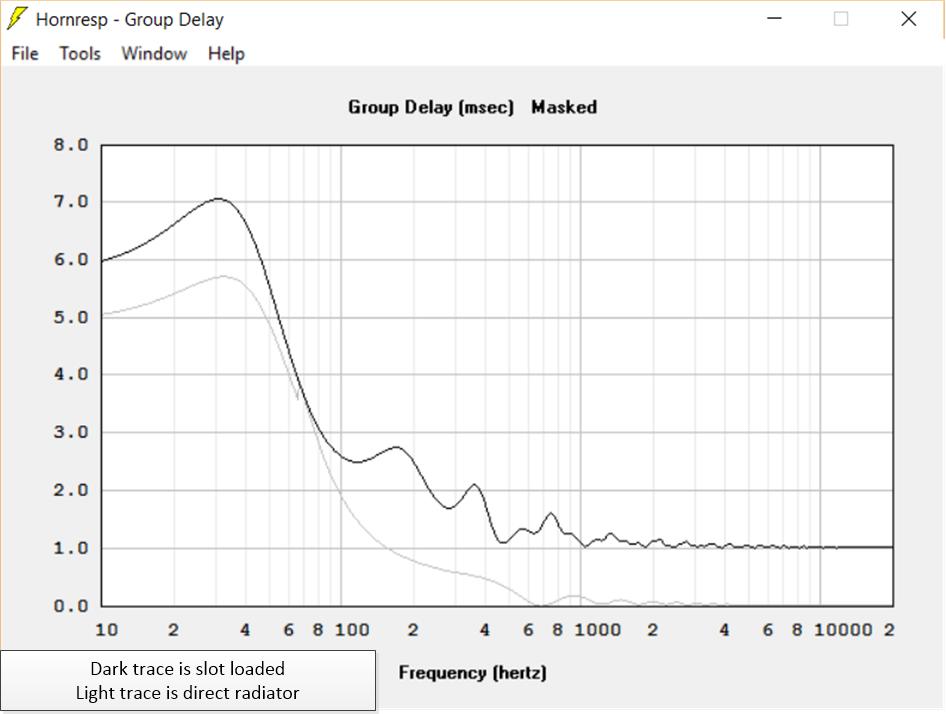
You can see the woofer has approximately 2 ms of delay right around where its being crossed over and that is why I need approximately 2 ms of delay for the mids to align with it. I could be off a little but not a lot. I had the woofer inverted early in the game when I was crossing it over at 200 Hz and the effect in TDA isn't subtle.
Jack
I appreciate all you are doing to help me get this right.
I'm going to take another look at the CD/mid XO. I think your second curve shows a bigger delay change around 1 Khz than I measure but the shape is right.
I don't think you are modelling the group delay of my woofer in these diagrams. I don't think there is an easy way to do it other than by simulating - because there is a horn path involved as well as a sealed box. That could be why we disagree about the woofer timing. Without the horn path, the DSP delay I would have on the mids would correspond to at most a few inched of path length delta.
Here is the graph from hornResp
You can see the woofer has approximately 2 ms of delay right around where its being crossed over and that is why I need approximately 2 ms of delay for the mids to align with it. I could be off a little but not a lot. I had the woofer inverted early in the game when I was crossing it over at 200 Hz and the effect in TDA isn't subtle.
Jack
Attachments
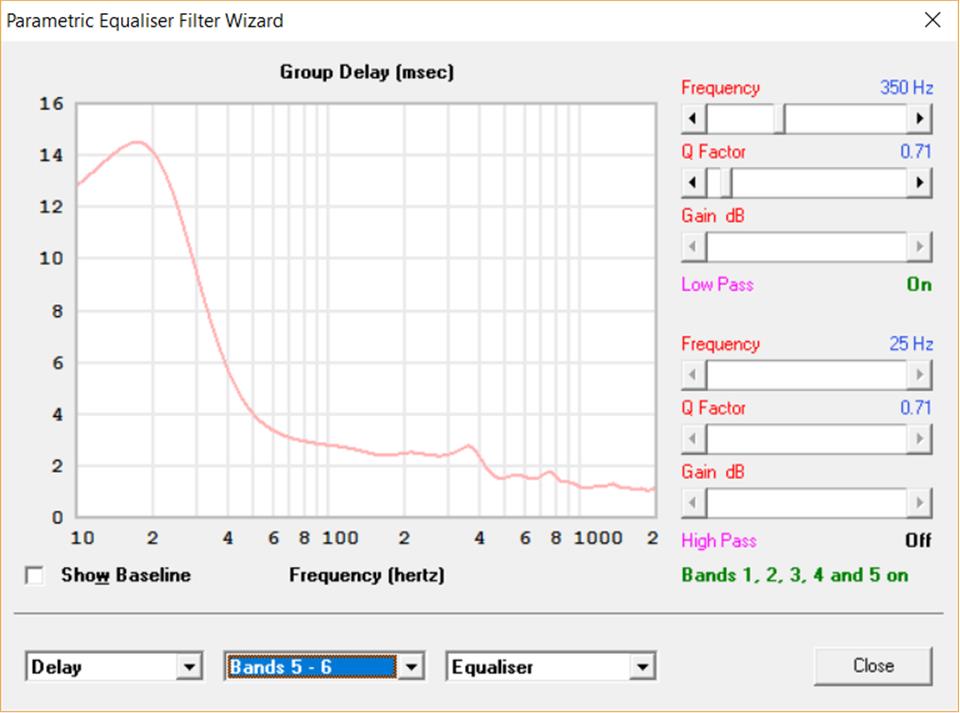
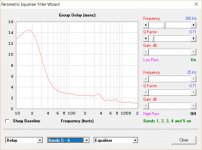
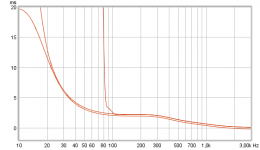
and here is woofer group delay with a quick and dirty approx to the XO filters.
In HR, I added a shelf to boost the low end, a 2nd order LPF and a single PEQ to flattten it. I did not eq to target slopes. Its comforting that the delay smooths out, its more consistent with what we see in TDA
In HR, I added a shelf to boost the low end, a 2nd order LPF and a single PEQ to flattten it. I did not eq to target slopes. Its comforting that the delay smooths out, its more consistent with what we see in TDA
Attachments
Hi,Let's compare the GDR of the reference to the speaker's delay curve.
Two GDRs generated by importing BRYTT's reference IR into TDA
this one with min phase subtracted ....
I don't know what to think of that but I'm sure its not a coincidence that the measured DFR at the LP is close to the GDR of the reference curve.
When system is very close to ideal tuning we should more trust to "GDR of FFTq".
The properties of DFR are such that it is showing situation little bit nicer that it is.
Please make such tune that GDR is not 0 on 200 Hz but has value 2 ms as it is in model. You should change your delay by 2 ms.
BR,
Raimonds
Interesting discussion. Why don't you just measure acoustically instead of trying to estimate horn path lengths? Also, your DSP electronics do add "length" for each filter it processes.
Another one - an ideal curve would be a straight vertical line - right?
You have been asked to add delay to a portion of the curve which is already somewhat delayed compared to 0ms - why is this good advice?
//
Another one - an ideal curve would be a straight vertical line - right?
You have been asked to add delay to a portion of the curve which is already somewhat delayed compared to 0ms - why is this good advice?
//
The straight vertical line will be only for linear phase crossover.
It must follow crossover's GDR in case of minimum phase crossover.
It is not good idea to try to make it "artificially" straight for a minimum phase crossover.
It must follow crossover's GDR in case of minimum phase crossover.
It is not good idea to try to make it "artificially" straight for a minimum phase crossover.
Interesting discussion. Why don't you just measure acoustically instead of trying to estimate horn path lengths?
//
The simulation was compared to the measurement as a sanity check, or vice versa
and here is woofer group delay with a quick and dirty approx to the XO filters.
In HR, I added a shelf to boost the low end, a 2nd order LPF and a single PEQ to flattten it. I did not eq to target slopes. Its comforting that the delay smooths out, its more consistent with what we see in TDA
another complication on the group delay modeling is the fact that the horn path is split into two vertical slots where the front of the woofer box meets the corner walls. When listening off axis as I do, I'm closer to one side than the other, changing the delay. Also when I measure at 1m, the delta path length Synergy to mic vs woofer to mic is different than when I measure at the LP. That latter difference doesn't seem to be significant.
So much for analysis, on to measurement!
.....I don't think there is an easy way to do it other than by simulating - because there is a horn path involved as well as a sealed box.....
Hi nc534,
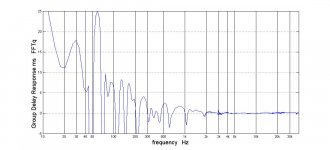
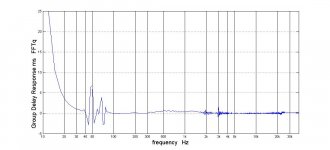
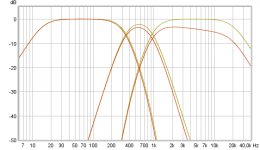
Thanks showing that dark trace masked group delay caused by sloth load, you right that will have to be set somewhere either physical or digital. That said think if amplitude slope for that pass band is precise then will isolated show in APL or REW as below and the masked group delay is not a problem before its summed with mid and tweeter and when their offsets is correct dialed in their phase track line up bring forward lobe in XO region.
Think complicated area around relative narrow mid band to get in precise cooperation, attach 96kHz target curves for use in APL or REW with and without B&K curve.
...So much for analysis, on to measurement!
... 🙂
Attachments
-
PB_W_B&K_96kHz.zip28.5 KB · Views: 65
-
PB_W_96kHz.zip28.5 KB · Views: 64
-
PB_T_B&K_96kHz.zip9 KB · Views: 54
-
PB_T_96kHz.zip7 KB · Views: 59
-
PB_M_B&K_96kHz.zip5.7 KB · Views: 63
-
PB_M_96kHz.zip5 KB · Views: 62
-
 2.png22.7 KB · Views: 300
 -
 1.png15.9 KB · Views: 296
 -
PB_W-M-T_B&K_IIR_XO_LR4_350-950_96Khz.zip35.3 KB · Views: 51
- Home
- Loudspeakers
- Multi-Way
- My Synergy Corner Horn and Bass Bins