First I'm going to play with TDA EQ
Nice! Looking forward to see more.
Two APL folks from the same state...just realized that.
Really? anywhere near Durham?
TDA EQ results
As some of you may have noticed, I just did a detailed review of APL_TDA
https://soundforums.net/forum/pro-audio/product-reviews/205223-a-new-way-of-looking-at-speakers-and-rooms-review-of-apl-tda
That turned out to be a more work than I anticipated but it was a good learning experience for me. I've now moved onto TDA_EQ which builds on TDA's ability to separate the direct from reflected response. The big issue in equalizing a response in room is deciding what not to correct. What we would like is to plop the speakers down into an untreated room, place speakers and chairs aesthetically, then perform some magic correction filter that results in totally accurate reproduction (with hot bass🙂). But we all know better than that. In general, that can't be done, especially if we have more than one listening position.
TDA_EQ builds on TDA but does multiple sweeps in quick succession while your hand moves the mic through a matrix covering the listening window. It then creates a composite AFR and equalizes to that. In the process, you can point it to mic and soundcard correction files and a target curve and set limits on the maximum boost and a frequency range outside which corrections aren't done. (I need to ask Raimonds to clarify the limit setting process because I'm not 100% sure I'm doing it right.)
If your hands move through the entire space covered by the speaker during measurement, then its sound power response is captured and corrected. The goal is to correct the speaker and not the room. Speaker corrections tend to be correct everywhere, room corrections are not. However as the measurement window is narrowed, it becomes possible to do a limited amount of room effect correction valid over a limited region.
I have 3 separate sets of measurement data to share, made in this order:
1. Measurement across the entire width of my listening couch made at the couch.
2. Measurement across the same polar angles but made at 1m from the speaker
3. Measurement made over a 2' square at the center of my couch but at the front edge of the couch instead of at its back.
The first measurement was made in a naive hope that the EQ would perform magic. I knew better, but I did it anyway to see what would happen. Unfortunately, the couch sits in a null of a strong longitudinal room mode and the carpet in front of it is insufficient to deal with floor bounce. (The room was described in previous posts and the review article.) This was too much for the software to correct. Nevertheless it made a valiant attempt.
One nice thing about both TDA and TDA_EQ is that they automatically record their IRs for future reference using essentially time codes for file names. I rename them descriptively ASAP for ease of future reference. Each time through the TDA_EQ IR you get the opportunity to reset the limits and target and correction curves.
First the across the full couch measurement and eq.
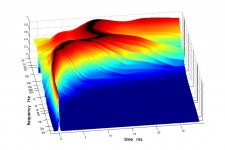
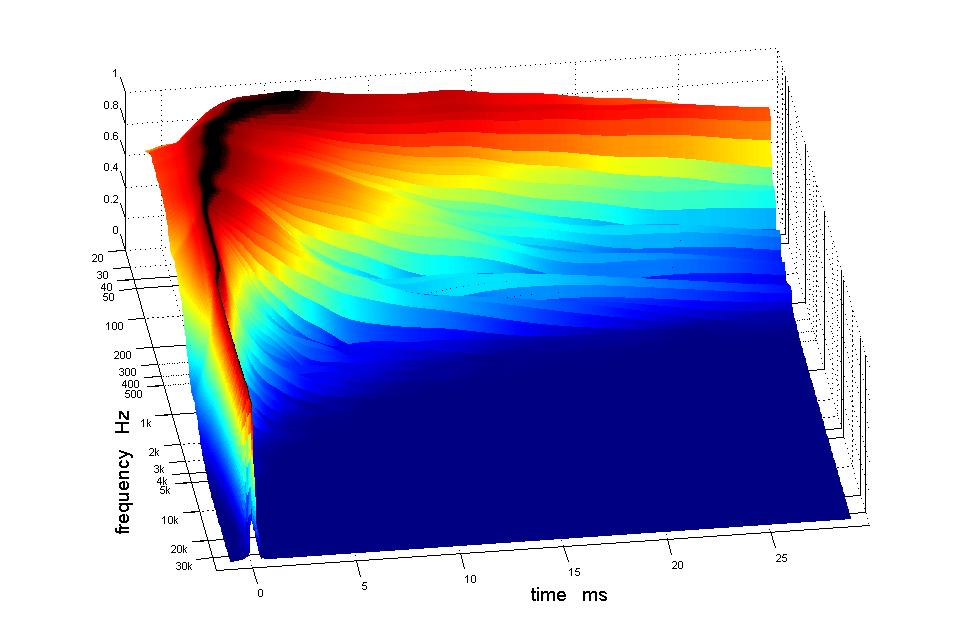
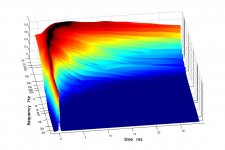
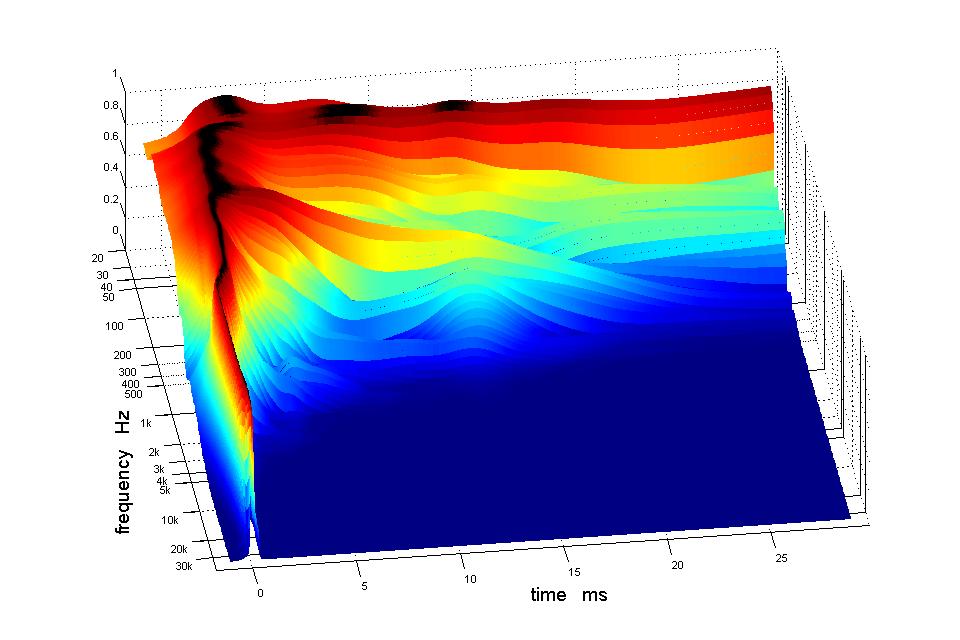
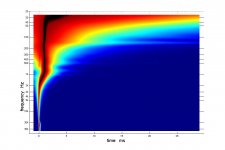
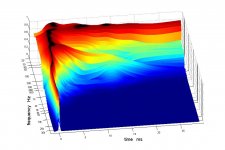
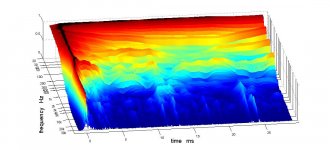
From the measurement, I get the familiar 3D graph, now a composite of multiple sweeps:

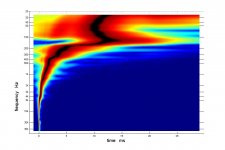
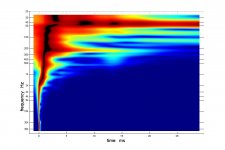
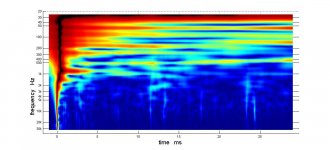
You can see the direct response standing out down into the midbass where it begins to bend due to the early reflections until its overwhelmed by a room mode lower down. The frequencies where this occurs is more readily seen in the "pl" chart:

There is that pesky dominant room resonance between 100 and 200 hz.
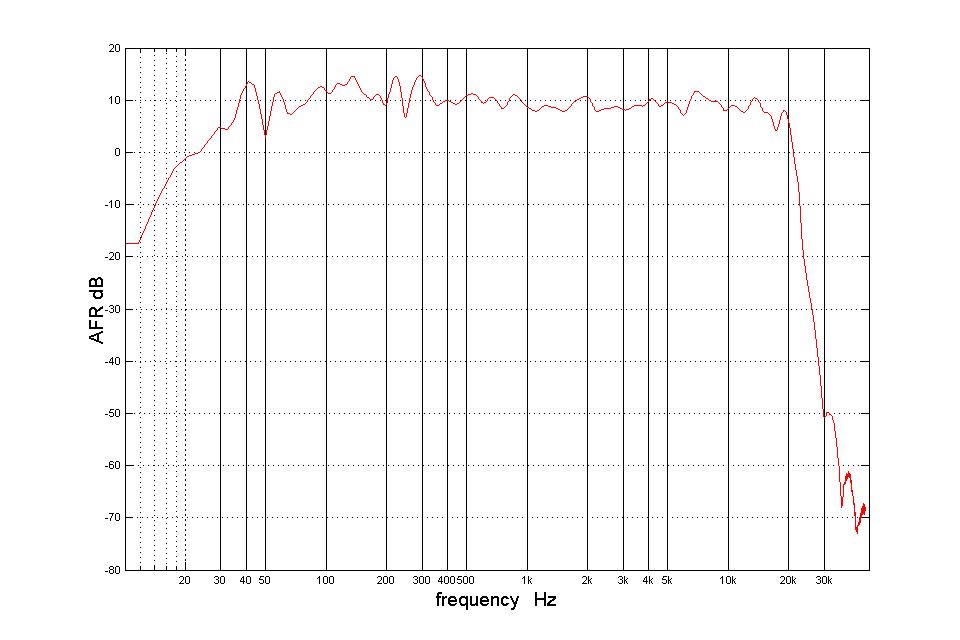
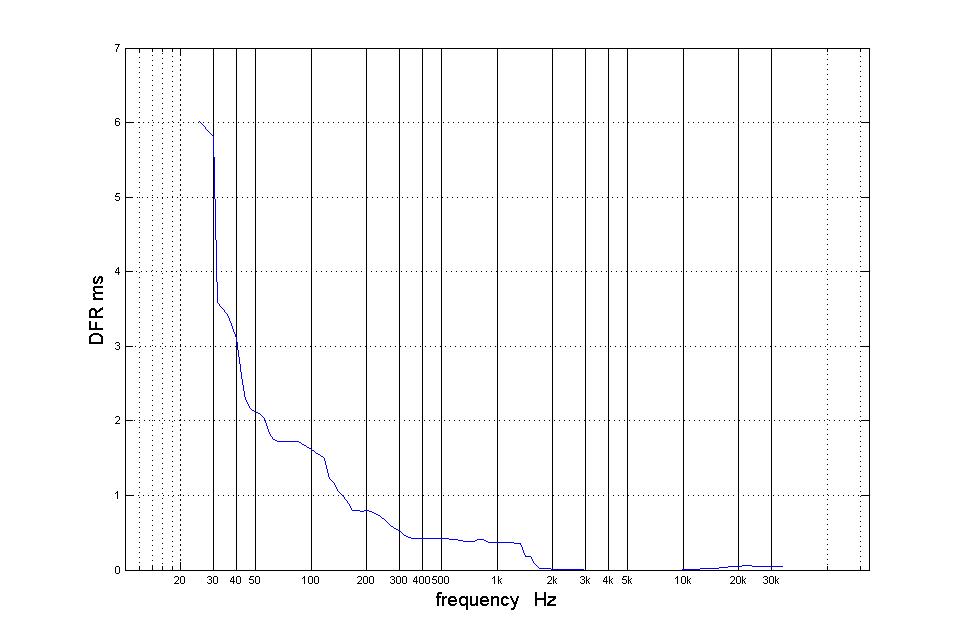
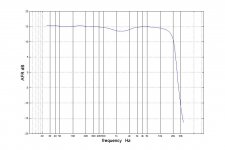
We also get the AFR and DFR curves, all pre-EQ:

There is also a more detailed AFRi to view:
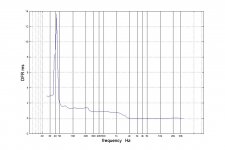
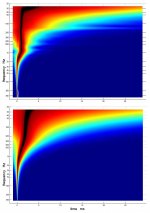
and then the GDR

This GDR is very different from what you see in TDA measurements at 1m. THe delay curve is apparently being distorted by the early reflections as well as the room resonances.
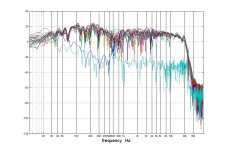
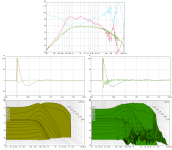
The "all AFRs" curve superimposes measurements from all the sweeps. The extent to which they line up on top of each other gives an indication of how successfull the EQ will be.

(every set of TDA_EQ measurements I've done has a "straggler" or two, IRs and corresponding afr curve that is anomalous. I'm not sure why.)
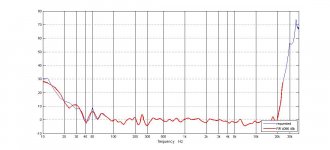
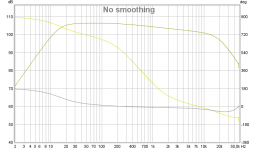
and then the correction filter itself:

I didn't set limits for this run so it is boosting bass all the way down to 10 Hz and treble up to 24 Khz. (sample rate was 48k) The correction looks like an inverse of the detailed AFR. The target/house curve isn't apparent in it but I recall Raimonds telling me that applying the target curve is a final post-processing step and doesn't show up in the graphs.
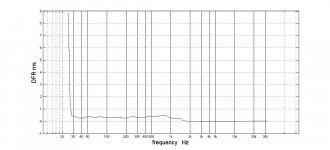
We also get post equalization graphs of "pl", AFR and DFR.


That clearly isn't as flat or as smooth as we'd like. How did it sound? Not much better or worse than the unFIRred sound. (There should be a Hippocratic oath for equalization software) I didn't like the sound with unlimited filter correction. When I set the limits it was much nicer. I wasn't driving the low bass into distortion or boosting the treble unreasonably.
My conclusion though was that there was too much room in the measurement for the software to deal with. Aside from treating the room more completely, my choices were to either measure closer to the speaker or restrict the measurement window. I did both but I'm out of time for now so will resume the story later.
First I'm going to play with TDA EQ
As some of you may have noticed, I just did a detailed review of APL_TDA
https://soundforums.net/forum/pro-audio/product-reviews/205223-a-new-way-of-looking-at-speakers-and-rooms-review-of-apl-tda
That turned out to be a more work than I anticipated but it was a good learning experience for me. I've now moved onto TDA_EQ which builds on TDA's ability to separate the direct from reflected response. The big issue in equalizing a response in room is deciding what not to correct. What we would like is to plop the speakers down into an untreated room, place speakers and chairs aesthetically, then perform some magic correction filter that results in totally accurate reproduction (with hot bass🙂). But we all know better than that. In general, that can't be done, especially if we have more than one listening position.
TDA_EQ builds on TDA but does multiple sweeps in quick succession while your hand moves the mic through a matrix covering the listening window. It then creates a composite AFR and equalizes to that. In the process, you can point it to mic and soundcard correction files and a target curve and set limits on the maximum boost and a frequency range outside which corrections aren't done. (I need to ask Raimonds to clarify the limit setting process because I'm not 100% sure I'm doing it right.)
If your hands move through the entire space covered by the speaker during measurement, then its sound power response is captured and corrected. The goal is to correct the speaker and not the room. Speaker corrections tend to be correct everywhere, room corrections are not. However as the measurement window is narrowed, it becomes possible to do a limited amount of room effect correction valid over a limited region.
I have 3 separate sets of measurement data to share, made in this order:
1. Measurement across the entire width of my listening couch made at the couch.
2. Measurement across the same polar angles but made at 1m from the speaker
3. Measurement made over a 2' square at the center of my couch but at the front edge of the couch instead of at its back.
The first measurement was made in a naive hope that the EQ would perform magic. I knew better, but I did it anyway to see what would happen. Unfortunately, the couch sits in a null of a strong longitudinal room mode and the carpet in front of it is insufficient to deal with floor bounce. (The room was described in previous posts and the review article.) This was too much for the software to correct. Nevertheless it made a valiant attempt.
One nice thing about both TDA and TDA_EQ is that they automatically record their IRs for future reference using essentially time codes for file names. I rename them descriptively ASAP for ease of future reference. Each time through the TDA_EQ IR you get the opportunity to reset the limits and target and correction curves.
First the across the full couch measurement and eq.
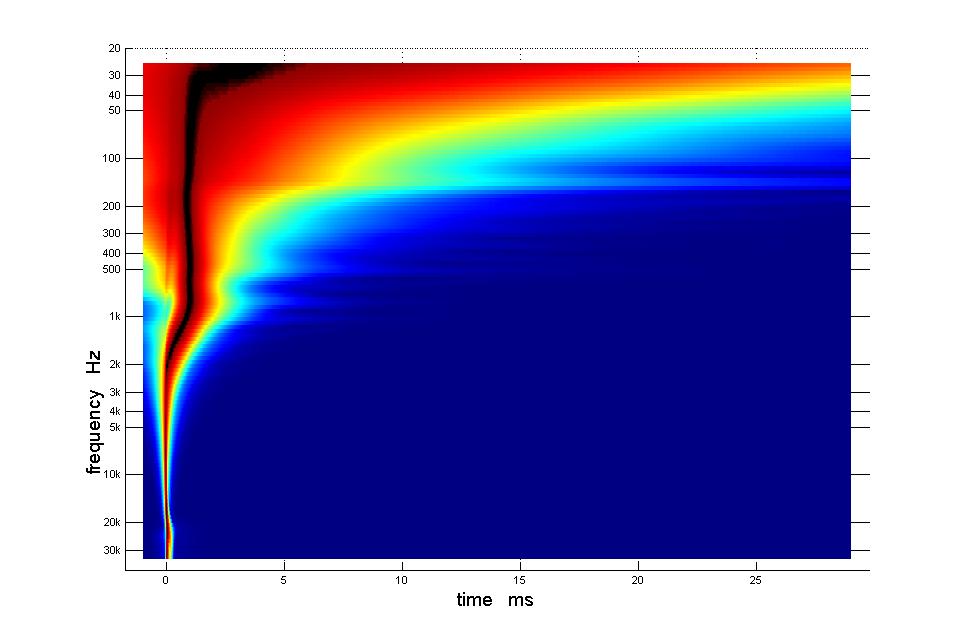
From the measurement, I get the familiar 3D graph, now a composite of multiple sweeps:
You can see the direct response standing out down into the midbass where it begins to bend due to the early reflections until its overwhelmed by a room mode lower down. The frequencies where this occurs is more readily seen in the "pl" chart:
There is that pesky dominant room resonance between 100 and 200 hz.
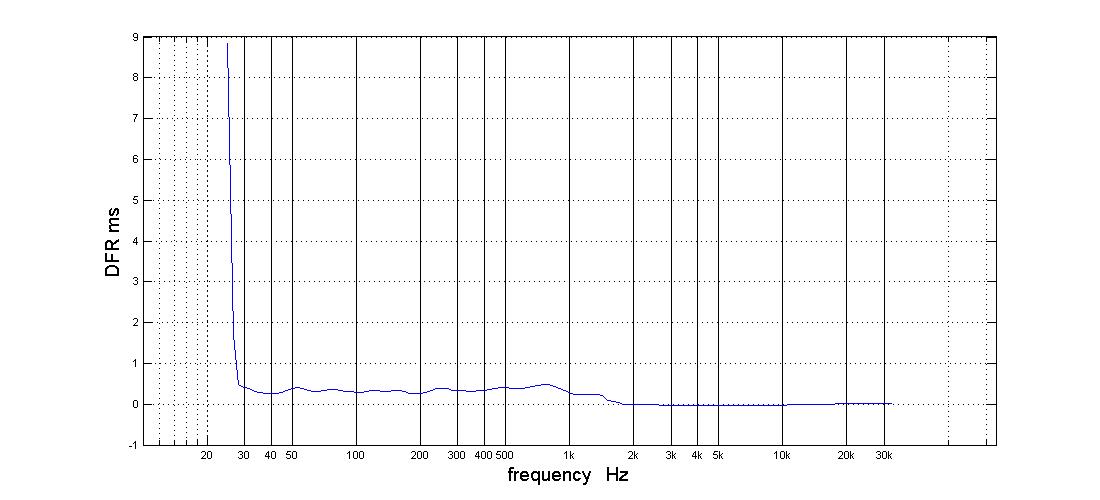
We also get the AFR and DFR curves, all pre-EQ:
There is also a more detailed AFRi to view:
and then the GDR
This GDR is very different from what you see in TDA measurements at 1m. THe delay curve is apparently being distorted by the early reflections as well as the room resonances.
The "all AFRs" curve superimposes measurements from all the sweeps. The extent to which they line up on top of each other gives an indication of how successfull the EQ will be.
(every set of TDA_EQ measurements I've done has a "straggler" or two, IRs and corresponding afr curve that is anomalous. I'm not sure why.)
and then the correction filter itself:
I didn't set limits for this run so it is boosting bass all the way down to 10 Hz and treble up to 24 Khz. (sample rate was 48k) The correction looks like an inverse of the detailed AFR. The target/house curve isn't apparent in it but I recall Raimonds telling me that applying the target curve is a final post-processing step and doesn't show up in the graphs.
We also get post equalization graphs of "pl", AFR and DFR.
That clearly isn't as flat or as smooth as we'd like. How did it sound? Not much better or worse than the unFIRred sound. (There should be a Hippocratic oath for equalization software) I didn't like the sound with unlimited filter correction. When I set the limits it was much nicer. I wasn't driving the low bass into distortion or boosting the treble unreasonably.
My conclusion though was that there was too much room in the measurement for the software to deal with. Aside from treating the room more completely, my choices were to either measure closer to the speaker or restrict the measurement window. I did both but I'm out of time for now so will resume the story later.
Attachments
-
 Full couch EQ initial 3d.jpg64.6 KB · Views: 528
 -
 full couch EQ initial pl.jpg51.5 KB · Views: 510
 -
 full couch initial AFR.jpg63.6 KB · Views: 509
 -
 full couch EQ initial DFR.jpg59.3 KB · Views: 528
 -
 full couch eq detailed AFR.jpg71.4 KB · Views: 521
 -
 full couch all AFRs.jpg102.3 KB · Views: 511
 -
 Full couch FIR.jpg64.7 KB · Views: 498
 -
 posts eq full couch AFR.jpg65.7 KB · Views: 496
 -
 post eq full couch dfr.jpg59.9 KB · Views: 494
 -
 post eq full couch pl.jpg50.2 KB · Views: 485
Last edited:
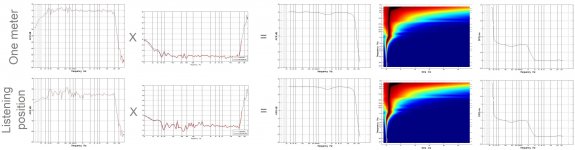
Here is what REW shows before and after the EQ:
At the couch, FIR OFF:

and FIR ON:
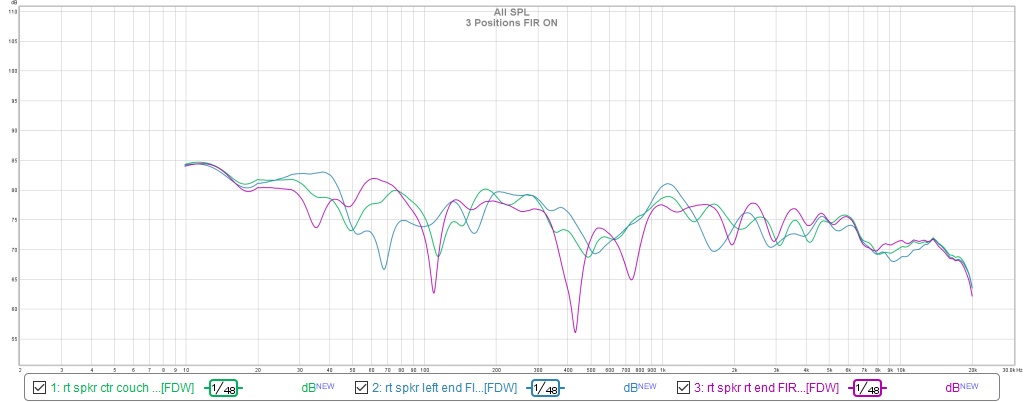
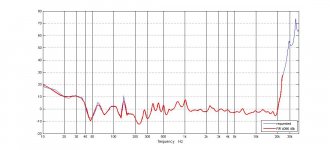
In the FIR ON picture, you can see my downward tilting target curve and bass boost but still a lot of room induced ripple. (Recall how smooth the earlier posted 1m measurement curves were.) The floor nulls are reduced but still present.
No I don't really want that boost below 20 Hz but it was there when I saved the picture. Listening, I liked the FIR ON a little better than off, probably responding more to the target curve than anything else.
At the couch, FIR OFF:
and FIR ON:
In the FIR ON picture, you can see my downward tilting target curve and bass boost but still a lot of room induced ripple. (Recall how smooth the earlier posted 1m measurement curves were.) The floor nulls are reduced but still present.
No I don't really want that boost below 20 Hz but it was there when I saved the picture. Listening, I liked the FIR ON a little better than off, probably responding more to the target curve than anything else.
Attachments
Let's now try at 1m from the speaker. I tried to confine the moving mic to the window that included the entire listening couch but excluded the rest of the room. Perhaps 8 degrees to 20 degrees off axis but just eyeballed.
The 3d at 1m is pretty much like what TDA showed with perhaps a little better discrimination against reflections due to the multiple measurements.
We don't really need the pl to see where the room shows up:

The AFR shows I did a decent job on the frequency response in the IIR XO
There are room induced ripples in the response but they don't down to zero so the response should be correctable.
The all AFR chart is very encouraging:
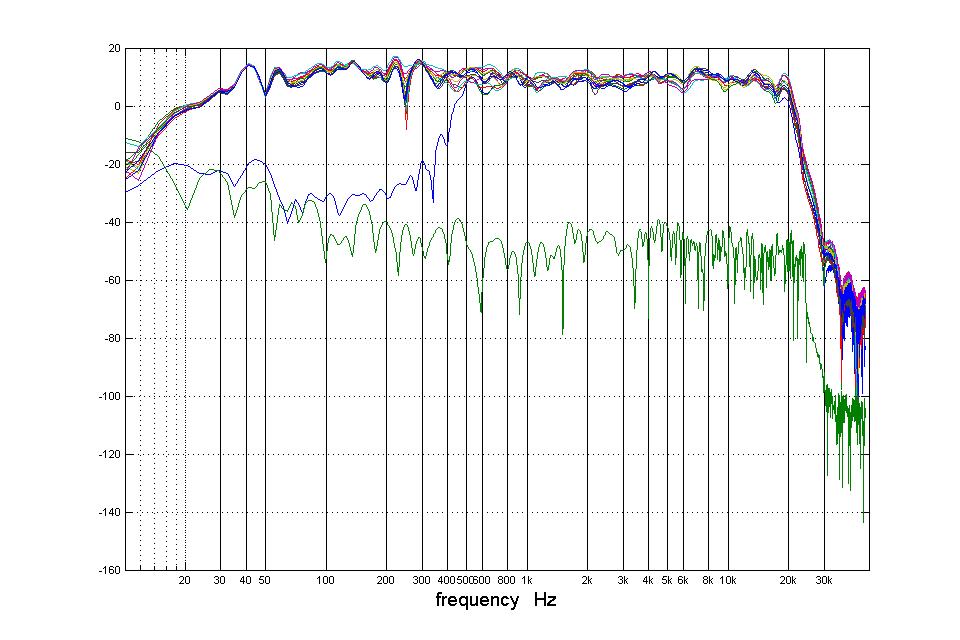
but nevertheless has two outlier curves.
Here is the post EQ pl. Compare it to pre-EQ and you see it is sharper.

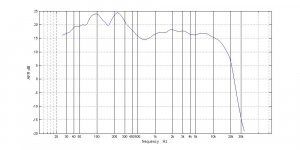
Here is the post EQ AFR. Its nicely flat, except for the dip around 1 Khz. There is an XO there but also some room effect. In the all AFRs, you see a horizontal band through that region rather than a thin line. Recall that the target curve doesn't show up in the AFR.

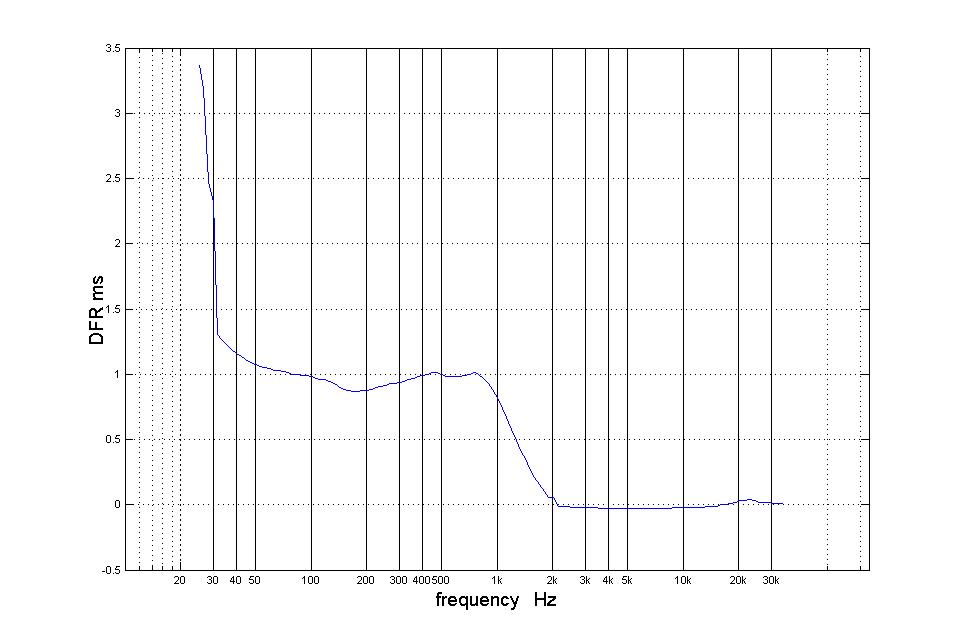
Finally the GDR. The delay hasn't been completely flattened but the shelf is only 1 ms high.
And the correction filter:
I can see no limits were set. I didn't listen to this one but went ahead to my third measurement.
The 3d at 1m is pretty much like what TDA showed with perhaps a little better discrimination against reflections due to the multiple measurements.
We don't really need the pl to see where the room shows up:
The AFR shows I did a decent job on the frequency response in the IIR XO
There are room induced ripples in the response but they don't down to zero so the response should be correctable.
The all AFR chart is very encouraging:
but nevertheless has two outlier curves.
Here is the post EQ pl. Compare it to pre-EQ and you see it is sharper.
Here is the post EQ AFR. Its nicely flat, except for the dip around 1 Khz. There is an XO there but also some room effect. In the all AFRs, you see a horizontal band through that region rather than a thin line. Recall that the target curve doesn't show up in the AFR.
Finally the GDR. The delay hasn't been completely flattened but the shelf is only 1 ms high.
And the correction filter:
I can see no limits were set. I didn't listen to this one but went ahead to my third measurement.
Attachments
-
 1m DFR init.jpg63.8 KB · Views: 476
 -
 1m all AFRs.jpg91.7 KB · Views: 469
 -
 1m AFR init.jpg71 KB · Views: 467
 -
 1m pre EQ pl.jpg48.7 KB · Views: 688
 -
 1m 3d.jpg61.1 KB · Views: 477
 -
 1m Post EQ DFR.jpg66.6 KB · Views: 474
 -
 1m post EQ pl.jpg43.7 KB · Views: 673
 -
 1m post EQ AFR.jpg66.6 KB · Views: 474
 -
 1m correction filter.jpg63.1 KB · Views: 476
For my third try, I elected to restrict the measurement window to an approximately 2' square region at seated head height at the front edge of the center of my couch. The reason for moving forward was that the back of the couch is apparently in a null of the 150 Hz room mode and 2' forward gets out of the null, improving the signal to room ratio.
The 3d display was encouragingly clean with the direct signal separated from reflections down into the bass:
The pl

The AFR init:

The DFR init:

And the post equalization graphs:
pl
afr

DFR

all AFRs

and the FIR itself

These post eq graphs look pretty much the same as the 1m graphs. That is one reason I didn't listen to the 1m correction. The other reason is that as soon as I started to listen to this one, I was hooked. Fortunately, I don't have to perch on the edge of my couch to appreciate it. It sounds good sitting on the floor in front of the couch and sitting all the way back at center. Its only slightly less good at the two end seating positions and that is more due to the image being pulled slightly off center there than the correction being audibly less correct.
The 3d display was encouragingly clean with the direct signal separated from reflections down into the bass:
The pl
The AFR init:
The DFR init:
And the post equalization graphs:
pl
afr
DFR
all AFRs
and the FIR itself
These post eq graphs look pretty much the same as the 1m graphs. That is one reason I didn't listen to the 1m correction. The other reason is that as soon as I started to listen to this one, I was hooked. Fortunately, I don't have to perch on the edge of my couch to appreciate it. It sounds good sitting on the floor in front of the couch and sitting all the way back at center. Its only slightly less good at the two end seating positions and that is more due to the image being pulled slightly off center there than the correction being audibly less correct.
Attachments
-
 ctr couch FIR.jpg67 KB · Views: 477
 -
 ctr couch all AFRs.jpg90.2 KB · Views: 465
 -
 ctr couch DFR post eq.jpg66.6 KB · Views: 465
 -
 ctr couch AFR post eq.jpg66.6 KB · Views: 466
 -
 ctr couch pl post eq.jpg43.7 KB · Views: 465
 -
 ctr couch DFR init.jpg66.7 KB · Views: 463
 -
 ctr couch AFR init.jpg63.3 KB · Views: 464
 -
 ctr couch pl.jpg54.6 KB · Views: 480
 -
 ctr couch 3D init.jpg64.4 KB · Views: 475
Great review on APL_TDA, not that hard to guess who it was coming from 🙂.
Even more fun is this TDA EQ part, looks like you found a good spot to measure at and the multiple measurements do a good job to get rid of most room effects.
I can imagine this will sound way better (more balanced too). Still a slight dip around 1 to 2 KHz. What kind of slopes did you end up using for the crossover at this frequency?
Good work, must be fun going trough your music library after this!
re' funGreat review on APL_TDA, not that hard to guess who it was coming from 🙂.
Even more fun is this TDA EQ part, looks like you found a good spot to measure at and the multiple measurements do a good job to get rid of most room effects.
I can imagine this will sound way better (more balanced too). Still a slight dip around 1 to 2 KHz. What kind of slopes did you end up using for the crossover at this frequency?
Good work, must be fun going trough your music library after this!
yeah you got that right. My wife remarked that yesterday was my longest listening session ever.
The XOs use 12 db electrical filters to hit a 24 acoustical target slope.
Excellent writing and visuals on findings thanks taking time share it.
Agree wesayso looks multiple measurements do a good job and most sound good in that new sweetspot, remember also to get some sleep in between : )
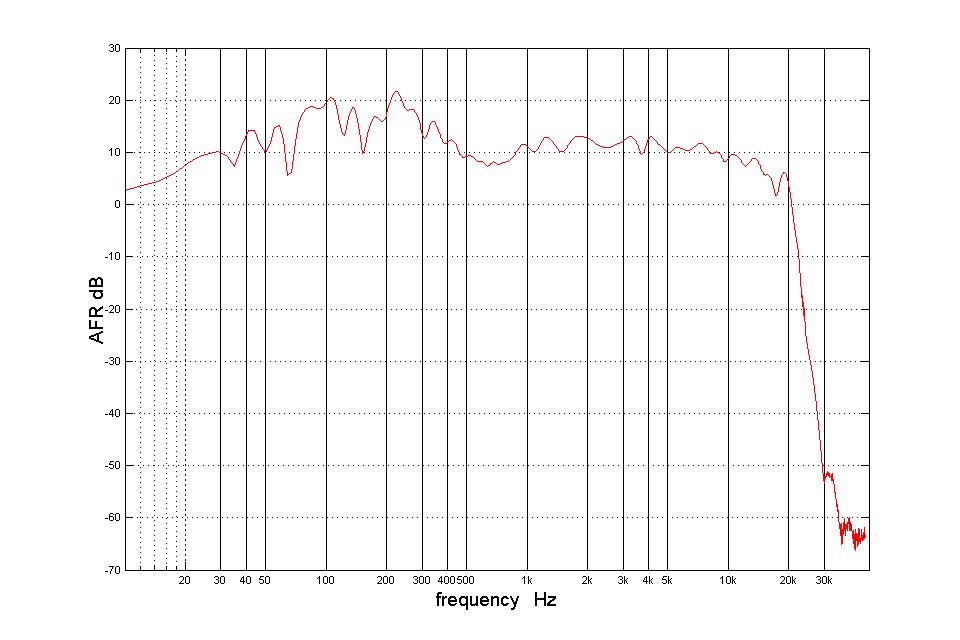
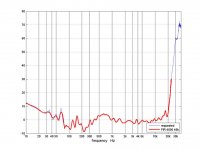
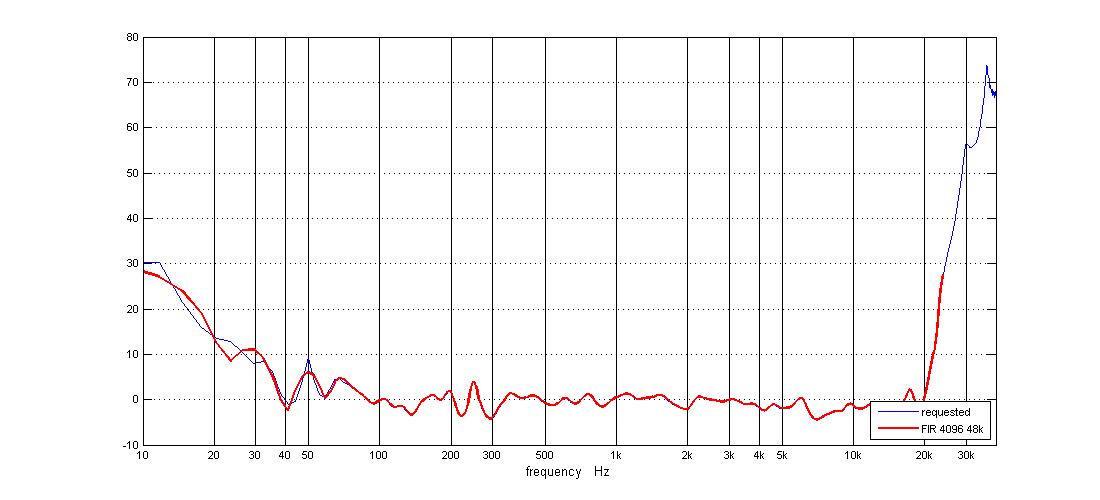
Out of interest and curiosity made a 96kHz perfect impulse wav-file over in Rehase, based 15Hz-20kHz band pass with B&K downward slope and 350 plus 950Hz LR4 XO. Imported to APL_TDA it looks like below and think yours real world acoustic with that new EQ setting at listening position is impressive, should you like that target curve it hang below in zip-folder. If DSP engine have more power available could try linearize the 950Hz IRR XO point and see what that brings.
Agree wesayso looks multiple measurements do a good job and most sound good in that new sweetspot, remember also to get some sleep in between : )
Out of interest and curiosity made a 96kHz perfect impulse wav-file over in Rehase, based 15Hz-20kHz band pass with B&K downward slope and 350 plus 950Hz LR4 XO. Imported to APL_TDA it looks like below and think yours real world acoustic with that new EQ setting at listening position is impressive, should you like that target curve it hang below in zip-folder. If DSP engine have more power available could try linearize the 950Hz IRR XO point and see what that brings.
Attachments
Excellent writing and visuals on findings thanks taking time share it.
Agree wesayso looks multiple measurements do a good job and most sound good in that new sweetspot, remember also to get some sleep in between : )
Out of interest and curiosity made a 96kHz perfect impulse wav-file over in Rehase, based 15Hz-20kHz band pass with B&K downward slope and 350 plus 950Hz LR4 XO. Imported to APL_TDA it looks like below and think yours real world acoustic with that new EQ setting at listening position is impressive, should you like that target curve it hang below in zip-folder. If DSP engine have more power available could try linearize the 950Hz IRR XO point and see what that brings.
amazing match between your synthetic curve and my measurement. I guess I shouldn't be surprised because that was what I was aiming for. Surprised to see it out at the LP, I guess.
yes thanks for that composite target curve. more important for me to get in the habit of making and using my own. That is how you steer TDA_EQ - via target curves.
Yes I have DSP headroom. Do you guys think the improvement from linearizing the XO would be audible? My priority is to finish the secondary flare I started and see if the improved vertical directivity helps around 1 Khz. (vertical pattern control would move down to about 800 Hz).
Jack
amazing match between your synthetic curve and my measurement. I guess I shouldn't be surprised because that was what I was aiming for. Surprised to see it out at the LP, I guess...
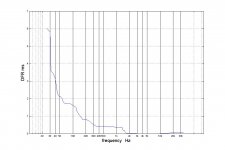
Agree at LP that is very good data so far and must sound quite good if house curve is satisfying dialed in, also imagine if you take same spot measurement using REW then in waterfall it will show the prettiest decay data in relation to earlier ones, guess somewhere 15-20dB clean ridge is possible mid and up before tails show up (slices set to 51 range set to 3mS window set 50 or 100mS and rise time set 0,1mS).
...yes thanks for that composite target curve. more important for me to get in the habit of making and using my own. That is how you steer TDA_EQ - via target curves...
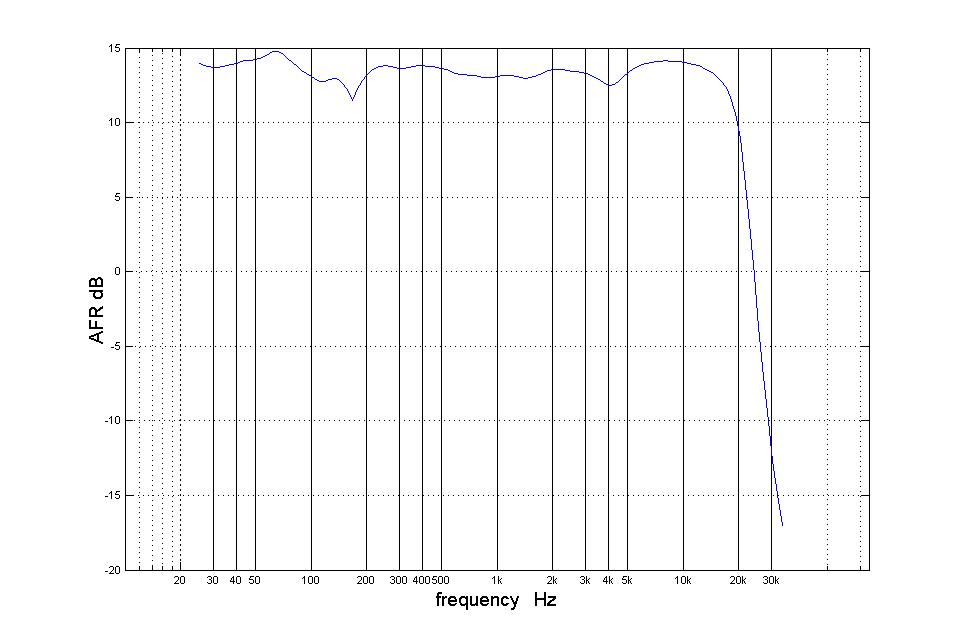
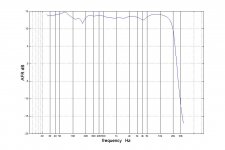
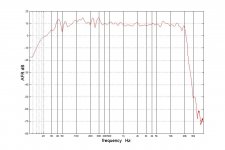
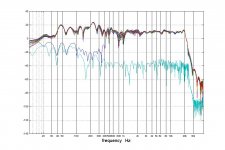
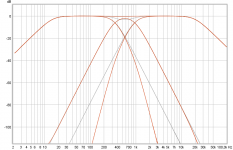
Guess myself little thick headed sometimes therefor really like support from synthetic made target curves, having those side by side real world data is fast way to find errors and get on track, there's a IIR example below not that its perfect but good example trying to EQ (blue) 2426H/2370a horn (red), showing target curves data side by side think helps confident in process. To have best coherence seems create them with same sample rate as actual measurement gear is setup, Rephase is fast generator and save as 32bit LPCM mono wav-file thereafter import to REW or APL_TDA. Normal target curve IIR pass bands are easy to create on "Minimum-Phase Filters" tab, the one from post 271 having not only system stop-bands but also IIR XO points inside pass-band is bit harder, amplitude system pass-band created on "Linear-Phase Filters" tab and housecurve curve done in PEQ tab, then on "Filters Linearization" tab set stop-bands and XO points, finally make magic on "General" tab invert "Time" and maybe invert "Polarity".
...Yes I have DSP headroom. Do you guys think the improvement from linearizing the XO would be audible? My priority is to finish the secondary flare I started and see if the improved vertical directivity helps around 1 Khz. (vertical pattern control would move down to about 800 Hz).
Jack
If its on way try flare first and see data, but in general think you should try linearization there.
Own experience from A/B tests adding allpass filters is 2kHz and up is impossible to hear a difference but closing in on 1kHz and down give much better realism as natural instuments sound and perceive one gets little bit closer into recording session environment, it is not night and day signs for me but take 1/2 an hour with same album tracks then 1/2 an hour with linearization and it get clear the bit better realism is satisfying quality improvement. Trying to figure out why it doesn't matter 2kHz and up a good point could be that create real square waves on tweeter even it reach 40kHz it run out of real squares in 4-6kHz, tweeter performance simply needs pass 100kHz area bandwidth or much more to see real changes down in audio band.
Attachments
Hi BYRTT:
Yes, I want to go back and see what this looks like in REW.
You guys already showed me how to generate target curves in RePhase then import/export with REW. I may still need the occasional reminder to use them, though.
I'm confident that if I give it a target curve and a decent direct signal to room effect ratio, it will give me a filter that implements that curve, limited by interference from the room at LF. But the target curve is just a magnitude response. I don't know what its decision process is re' delay correction.
The GDR I'm getting out at this LP is not the same as what I measure at 1m; the early reflections are changing the apparent delay. But that apparent delay is probably what I hear because the reflections causing it are very early - less than 1 ms. So I agree, I should try linearizing around that XO.
But I think the first order of business is to figure out why TDA_EQ left the dip in around 1 Khz. Look at the All AFRs chart - you will see quite a bit of variation in the individual sweeps there. In fact, 800 to 1200 Hz is where there is the most variation. That is all due to early reflections because TDA is very good at discriminating reflections later than 5 ms. That is why I think a 2ndry flare will help. If it indeed lowers the vertical pattern control frequency to around 800 Hz, then those early reflections in that region will be significantly reduced.
Jack
Good plan Jack, we've got to keep in mind that the multiple measurement technique drops the room influence in these plots. But a single TDA measurement (or REW for that matter) will still show more room in the plots. If you're able to reduce that it will bring even better results out at the listening spot.
The more very early reflections you can avoid, the better the imaging. The later reflections will still alter what you hear but it isn't that negative of an effect in a lot of cases.
You might want to start with a normal ungated REW measurement at the LP (just in front of that couch) to see if the slight dip get filled in by room reflections.
There can be quite a perceptive difference with a dip at 1-2 KHz, depending if later reflections fill it in or not. Usually we suffer from Stereo cross talk creating a dip right there. Fill it in and you gain in "the sense of depth" department. With some reflections present (hopefully diffused enough) it could have the added benefit of perceiving that depth. But ideally at least the first ~5 ms should be real clean. That gives you a more focussed image.
Basically you fixed the speaker with TDA EQ, but you're still listening to speaker + room. Your brain is well trained (all your life) to ignore the room. If you want to listen to the room, record a song at the LP. Play it back on headphones. That will make it clear what your brain drops/ignores while listening at the LP. You could also listen to that recording played back on the speakers, but after that you'll have a much harder time to "not hear" the room. I should know, I've been there 😉.
nc535 and wesayso you probably right in good points there, but in APL other than response plus correction itself its very hard see difference 1 meter verse LP.
Attachments
Last edited:
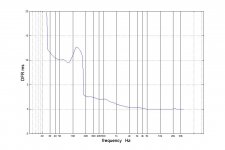
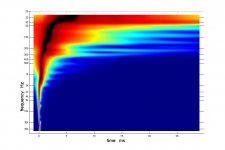
Don't know if there's anything in this theory example but it gives ripple errors close to 1kHz area when neighbor band-pass slopes aren't calculated into each target curve band-pass. Grey curves are clean 15-350/350-950/950-20000Hz where brown LP is example 15-350 plus 950 and 20000Hz LP. For this particular band-pass sum mid slope doesn't seem change much but woofer/tweeter do.

Attachments
Don't know if there's anything in this theory example but it gives ripple errors close to 1kHz area when neighbor band-pass slopes aren't calculated into each target curve band-pass. Grey curves are clean 15-350/350-950/950-20000Hz where brown LP is example 15-350 plus 950 and 20000Hz LP. For this particular band-pass sum mid slope doesn't seem change much but woofer/tweeter do.
BRYTT:
Thanks for pointing this out.
I originally EQed each driver in the XO to conform to the 24 db target acoustical roll off with the mic on axis at 1m. But later I realized that I wasn't listening on axis and so I re-EQed to be visually flat at the off axis angle corresponding to the center of my couch. In doing this I didn't pay any attention to the target curves for individual drivers; I simply EQed the result using a mix of input PEQs and output PEQs depending on resources remaining available in the MiniDSP. So yes, I'm guilty of hacking. I will take the lesson of your methodology to heart; its not one I haven't long known so much as one seemingly set aside when I retired.
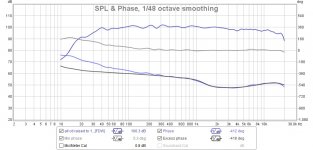
However, looking at the REW measurement taken during the XO tuning, I see a small peak at 1 khz rather than a dip.
Just for the record, here is the same plot with a min phase trace added:
Jack
PS: REW says 1/48th octave smoothing but there is also 5 cycle FDW
Attachments

The issue about the response at 1 Khz is still open. Is that the XO's group delay we are seeing there or due to the room?
Instead of waving my hands, I made a single point TDA measurement out at the favorable listening position. We are used to looking at TDA graphs so this is somewhat of an apples to apples comparison.
Here are the graphs.
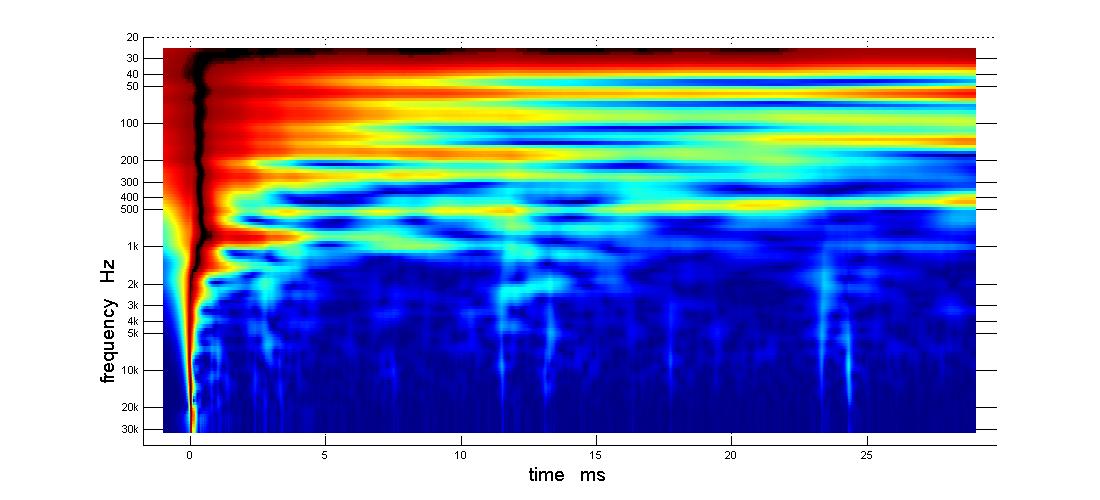
3D with nearly a straight line direct response

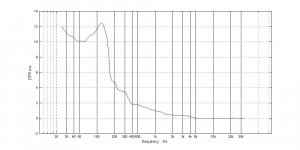
"pl" showing a couple of resonances
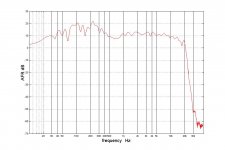
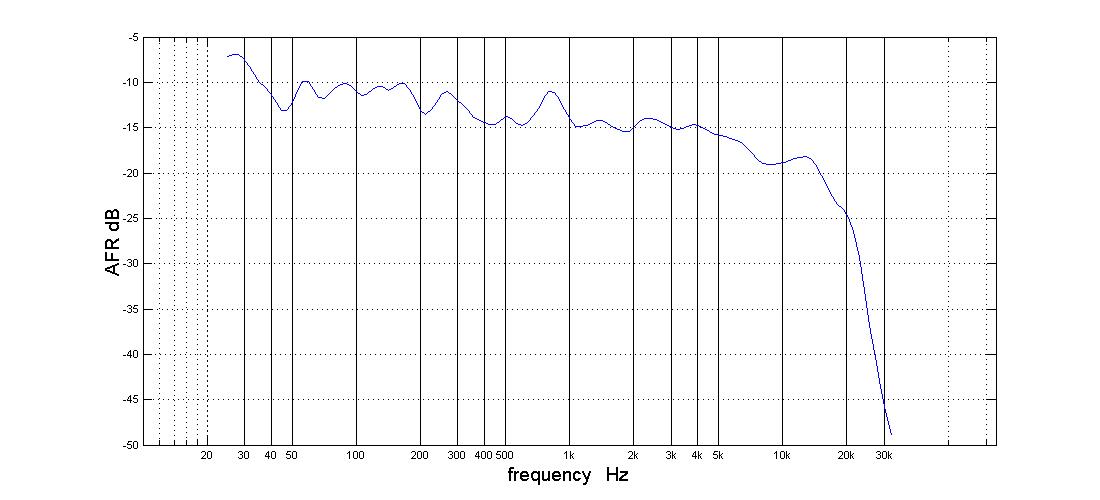
The AFR
The DFR, mostly corrected
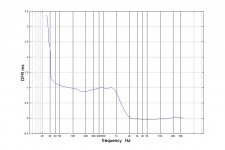
and the GDR with min phase subtracted, which should leave the XO's group delay (+non min phase room effects)

Instead of waving my hands, I made a single point TDA measurement out at the favorable listening position. We are used to looking at TDA graphs so this is somewhat of an apples to apples comparison.
Here are the graphs.
3D with nearly a straight line direct response
"pl" showing a couple of resonances
The AFR
The DFR, mostly corrected
and the GDR with min phase subtracted, which should leave the XO's group delay (+non min phase room effects)
Attachments
-
 TDA 3D measured ctr couch forward 2 ft with FIR ON.jpg67.9 KB · Views: 350
 -
 TDA pl measured ctr couch forward 2 ft with FIR ON.jpg65.9 KB · Views: 330
 -
 TDA AFRl measured ctr couch forward 2 ft with FIR ON.jpg68.2 KB · Views: 335
 -
 TDA DFR measured ctr couch forward 2 ft with FIR ON.jpg69.7 KB · Views: 329
 -
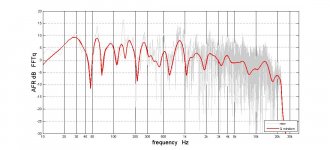 TDA AFR q2p5 measured ctr couch forward 2 ft with FIR ON.jpg78 KB · Views: 92
 -
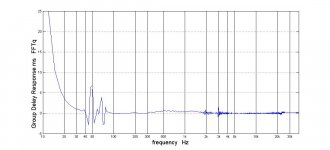 TDA GDR min ph subtr measured ctr couch forward 2 ft with FIR ON.jpg54.6 KB · Views: 376
The TDA 3D out at the LP looks pretty good and shows better delay characteristics than predicted by TDA_EQ. It is a single point measurement, as opposed to the average of multi-point measurements presented by TDA EQ, and it was taken in the center of the sweet spot.
Looking at the "pl", I see quite a lot of room resonances. It seems to me I would get the best ROI on time spent cleaning them up rather than spending more time on equalization. After all, its the room effects that limit the equalizer.
I guess the next question is what does REW see there but I'm afraid to turn the system back on. In my haste to shut it off to go to lunch, I turned off the minidsp first and instead of last and got such a "CRAAACK!" that I fear for my CD/tweeter.
Jack
- Home
- Loudspeakers
- Multi-Way
- My Synergy Corner Horn and Bass Bins