Planet10,
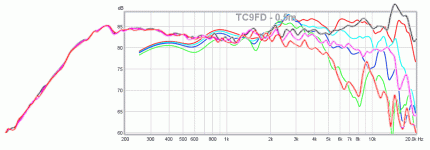
Why is it black line because it's a high resolution data that you try to explain is same as red line consumer datasheet that you had made an error to, but the error is too big those two not the same, and probably why you deleted because of realizing.
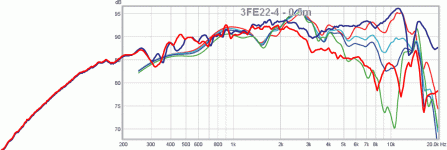
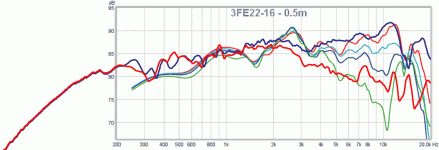
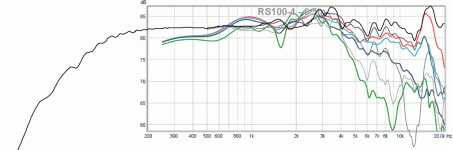
I am not sure what you are trying to say. I replaced graphs where i had mistakingly scaled the data horizontally by lining up the 20 Hz of the factory to XRK's 200 Hz (i had missed that XRK had truncated his graph). Ryan pointed this out, i corrected the error and replaced incorrect graphs with correct ones.
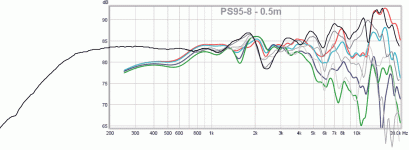
I have attached the rest of the set (factory data vrs XRK) so people can make their own judgements to the veracity of XRK's claim of that his data matched the factory. No 10F data yet, since XRK changed his measure technic which makes it different than the rest. Also no PS95 graph, as i could not find factory data. As well, one has to mentally smooth the CHN70 data to have it make any sense.
dave
Attachments


Lots of pretty colorful lines. Which is which? There seems to be some correlation in some plots but none in the Markaudio plot.
Why are we comparing factory data to what X measured anyway? Hasn't it been established that manufacturers go to great lengths to make their drivers look best? Wouldn't it be more helpful if others would post their measurements? Didn't you promise to do so?
Oh and by the way, this is the 'Vifa TC9FD18-08 best bang for the buck' thread. I'd like to see measurements of drivers that outperform the Vifa and cost LESS.
And I'd like to see measurements of drivers which outperform Visaton B80 and ScanSpeak 10F and cost less..I'd like to see measurements of drivers that outperform the Vifa and cost LESS.
And I'd like to see measurements of drivers which outperform Visaton B80 and ScanSpeak 10F and cost less..
Those drivers are pretty expensive and both of them need a supporting woofer like any other 3" design if you want to push distortion to a reasonable level. It's most likely cheaper to do a conventional 2-way with waveguide and have better performance.
And I'd like to see measurements of drivers which outperform Visaton B80 and ScanSpeak 10F and cost less..
The TG9FD10-8 has maybe 95% of the performance of the 10F at about 20% the price - I think that is pretty good value.
The TC9FD18-8 ha maybe 90% performance of 10F at 10% the price. That is real value.
Still waiting for the B80 to get here - a couple of weeks more. Probably very similar to 10F/8424.
Last edited:
The TG9FD10-8 has maybe 95% of the performance of the 10F at about 20% the price - I think that is pretty good value.
The TC9FD18-8 ha maybe 90% performance of 10F at 10% the price. That is real value.
Still waiting for the B80 to get here - a couple of weeks more. Probably very similar to 10F/8424.
Wait a minute:

90% performance at 10% the price ...
90% x (1 / 10%) = 900% !!1!11!!

Thanks goodness I have some! 😉
Last edited:
I am not sure what you are trying to say. I replaced graphs where i had mistakingly scaled the data horizontally by lining up the 20 Hz of the factory to XRK's 200 Hz (i had missed that XRK had truncated his graph). Ryan pointed this out, i corrected the error and replaced incorrect graphs with correct ones.....
Once again your #439 over there had for some hours the plot which you have deleted because you can and now hide for us for, how i have this read again #245 http://www.diyaudio.com/forums/full-range/268626-vifa-tc9fd18-08-best-bang-buck-25.html#post4248817, and this plot have ever never been same as the one you feed us now, no hills and valleys those two to match and mistaken scaling is impossible too especially taking into to count your many years Adobe experience. Now you are nit picking verse datasheets when scaled correct but take a look as is from manufacture and tendency is best the others compared your child. A question is do you accept the frequency response revealed for CHN-70 by comparison thread and Japanese site as you did by showing the deleted plot picture saying "For CHN-70. Factory data (Earthworks M30 in anechoic chamber on IEC baffle using LMS) scaled and laid over top XRK's", it looks like it when you now show the datasheet factory painting.
And now lets talk DDR 😡, no but it will be good to hear if you accept the relative steep curves at 700 and 6000 area which make it a good midrange with splendid off axis.
Last edited:
Why are we comparing factory data to what X measured anyway?
Because XRK claimed that all of his measures, except the MA one, closely matched the factory measures and therefore his muct be correct.
dave
A question is do you accept the frequency response revealed for CHN-70 by comparison thread and Japanese site as you did by showing the deleted plot picture saying "For CHN-70. Factory data (Earthworks M30 in anechoic chamber on IEC baffle using LMS) scaled and laid over top XRK's", it looks like it when you now show the datasheet factory painting.
I still don't know exactly what or why you are going on. I deleted 2 wrongly scaled graphs and replaced them with properly scaled graphs. The mistake was made because XRK chose to truncate the charts at 200 Hz, and, in a hurry, i assumed the standard 20 Hz, not paying sufficient attention. All the rest of the post was valid.
Are you giving me a hard time, because i paid attention to another members observation, correct MY mistake and replaced invalid data with valid data?
dave
The TC9FD18-8 ha maybe 90% performance of 10F at 10% the price. That is real value.
That is a subjective evaluation.
I have both, have listened to both, and my subjective opinion is quite different.
I agree that the Scan Speak is mechanically a beauty, has very good performance but is over-priced. The VIFA is the $13 TV-speaker it purports to be. Its performance is in line with its price.
Neither is capable of any bass and as such are really mid-tweeters.
dave
planet10,
They were not wrongly scaled graphs and replaced them with properly scaled graphs, it was the one i showed #245 this thread also a CHN-70 but raw high resolution and if smoothed close to xrk971 and Japanese plots, that one you deleted after several hours because you can, had you not had moderator privilege you have had to answer why new MA factory data is not as MA datasheet. Can't bring the original picture to surface else than the thread print i showed so stop here can't go forever.
Again do you accept the relative steep curves at 700 and 6000 area shown xrk971, Japanese, and your deleted plot, or are they still wrong and actual performance as datasheet or simply better.
showed #245 this thread
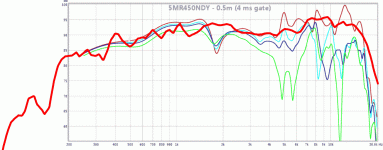
That is the comparison of the SS 10G factory data to XRK's, As XRK has said, his data is 10 degrees off axis, so this chart is not showing anything useful. Why XRK chose to switch from on-axis (his other measures) to10 degrees off i do not know.
also a CHN-70 but raw high resolution and if smoothed close to xrk971
My 1st CHN chart was incorrectly scaled and used MA data i has on my HD. I replaced that plot with one correctly scaled and using factory CHN data supplied by XRK.
that one you deleted after several hours because you can, had you not had moderator privilege
If i did not have moderator priveleges i would have asked a mod to replace the invalid chart with the valid one. That is something any one can do and is encouraged to do.
The one that disappeared was crap.
Why are you obsessing over this? You prefer to use known invalid data?
dave
The VIFA is the $13 TV-speaker it purports to be. Its performance is in line with its price.
Every single measurement that I've ever seen of that driver would say otherwise...and I'll take measurements any day over some subjective waffle.
Maybe everyone should buy a pair each of CHN-70's and TC9FD's, a sheet of plywood, build some boxes and make their own judgement.
I don't think there are any graphs that will change anyone's opinion at this late date.
-Tom-
I don't think there are any graphs that will change anyone's opinion at this late date.
-Tom-
Every single measurement that I've ever seen of that driver would say otherwise....
Hopefully more than the 5 octave measurements XRK is posting? Please point them out.
and I'll take measurements any day over some subjective waffle
Have you ever heard a pair? Have you ever bought a driver on its measurements and been dissapointed with it? (come-on thell the truth)
dave
In the photography forums there is a large subset of people who like to shoot test charts or brick walls and argue about sharpness. Sharpness devolves into the only important characteristic of the lens, although there are many other characteristics which are just as important, but harder to measure, that contributes to a lens performance. Someone (the infamous Ken Rockwell perhaps) refers to these people as "measurbators".
A lens is a tool to take photos, and the important thing is the photos that it produces. Sometimes a lens's faults are integral to the photo produced. The important thing is the photo, not the test chart.
Here we are arguing that flatness of response is the only important characteristic of a driver. The questions we should ask are "Is the manufactures numbers good enough to design an optimum or near optimum box?", and "Do we enjoy listening to the resulting speaker?".

Tom, thanks for adding that descriptor to the conversation- I almost choked on the Australian Cabernet is was sipping at the time (Penfold Rawson's Retreat, a delightful little dirt cheap Cab/Sav - now it's time for the oenophiles to criticize my taste 🙄)
For me, the answer to the last question is the primary goal.
For me, the answer to the last question is the primary goal.
Last edited:
Hopefully more than the 5 octave measurements XRK is posting? Please point them out.
Zaph for one has measured them, others have too, but Zaph's are the only I specifically remember so are the only ones I can point out. They are on his blog.
Zaph's measurements are fairly similar to XRKs measurements too. I don't really see any problems with the measurements that XRK is posting, sure there's a bit of smoothing, some cabinet and room influences too, but the results are consistent from driver to driver and are very useful for at least making comparisons. His distortion measurements leave a lot to be desired imo though, as do many from third party sources, that including a lot of reputable magazines. The distortion measurements need to be done at a higher drive level with the graphs expanded so you can clearly see the difference between the 2nd, 3rd, 4th and 5th harmonics, if they are buried within the scale of the bottom of the graph they are completely useless.
Have you ever heard a pair? Have you ever bought a driver on its measurements and been dissapointed with it? (come-on thell the truth)
dave
I have the TG9 fibreglass cone. The driver needs a tweeter and a phase plug otherwise pole vent resonances severely affect its distortion performance at higher driver levels (especially in the bass and lower midrange). With all of that in place though, along with a passive xover and DSP before the speaker to correct for bafflestep losses, to perfect the upper end tonal balance and to EQ the bass they sound wonderful.
I have NEVER bought a driver based on measurements alone and been disappointed with it. I have purchased some without seeing measurements and wished I'd bought something else however because they hadn't performed as well as I'd hoped.
We live in different audio worlds though, I live in a world of measurements and filters and readily throw a DSP at linear distortion to make a system sound good. I've built several full range systems, some sound better than others without a filter in place, but to assess a driver based upon its filterless performance is a bit pointless imo.
It's a bit like XRKs subjective test. Some of the drivers used are low qts and some are high. With his generic highpass filter in place and the drivers' resonances inherently close to the corner frequency some of the drivers appear to have a bit of extra output around the lower midrange that adds some warmth to the sound whereas some don't. Really a linkwitz transform should be used on each driver to EQ their lower end so that they all have an equal resultant Qt and F3. But then that may defeat the point of XRKs test, whatever that may be. Still it's a fun experiment and it's going to be interesting to see what people prefer. I think there are going to be some surprises!
The only useful measurements of a driver are when it is mounted for application. Then if equalization is employed, the transfer function of the EQ should predict the resulting response. If the measured result with equalization doesn't match the predicted result, then root cause should be investigated.
- Home
- Loudspeakers
- Full Range
- Vifa TC9FD18-08 best bang for the buck