It still has built-in diffraction.IMHO, the M2 looks this way for the following reasons:
1) A wide waveguide generally has flatter response than a narrow waveguide. One way to examine this is to look at the measurements of Danley's narrow angle synergy horns, like the SH25, versus the SH50 or SH60. Narrow angle waveguides have more ripple.
2) A narrow waveguide has higher output on-axis. This is simple; it's the same amount of energy focused into a narrower 'cone'
So we have a couple of competing criteria. If you want it smooth, you want a wide angle waveguide. If you want it to have very high output, you want a narrow angle waveguide.
So the JBL has both. At 0, 90, 180, and 270 degrees it's a narrow angle waveguide. At 45, 135, 225, and 315 degrees it's a wide angle waveguide.
(Note that I'm only talking about the first couple inches of the waveguide.)
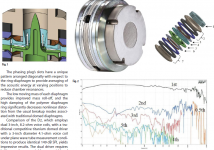
I think another factor is that the waveguide shape also varies the pathlength with angle. From reading the AES paper of the designer, he uses 'randomization' in the phase plug of the compression driver. So the pathlength variation might be another way to 'randomize' the response.
Plus, it just looks cool.
As i see it /given design constrain and objectives/ it is very clever engineering.
I still don't see it that way. Take Genelec for example, they use a smooth waveguide to get a very wide directivity. They use a direct radiator, but a compression driver with a short throat is very much like a direct radiator.
As to performance, I have not seen any data so I don't know how well the device works. But I do know that it is not the only way to achieve the intended results. It may not even be the best way. There isn't enough data to know either way.
JBL M2 has also the new D2 driver which obviously is a critical component to match with the new waveguide. Any speaker is a buch of comprmises!
Its an interesting driver concept. But I keep coming back to the test that we did comparing a mega-buck TAD with a DE250 in an identical system design. The results indicated that the two systems were statistically the same (some 30 listeners in blind tests). So I just do not see a "new" driver making all that much difference.
Can you share more about how the blindtest was conducted?Its an interesting driver concept. But I keep coming back to the test that we did comparing a mega-buck TAD with a DE250 in an identical system design. The results indicated that the two systems were statistically the same (some 30 listeners in blind tests). So I just do not see a "new" driver making all that much difference.
I'm believer in blind tests, but it I think the trustworthiness of it depends on several factors. Take of instance the blindtests that some radios in Europe did on losless vs MP3. I think the MP3 was in 192 kbps but I'm not certain. Point is that blind test gave them a null result and they used that to justify no need to broadcast anything else. Problem is that other blind tests have come to other conclusions. And we also have seen that trained listeners not only can differeniate between MP3 in 256 and 320 kbps but also distinguish different codecs being used.
We have the similar with blind tests of amps. Some seem to show differences, others give a null result.
A blind test can be conducted in many different ways and can't be used every time as a 100% proof. It basically tells that in the spesific setup with that spesific test, the result was so and so.
In my opinion the acoustics of the room is very important. One hears details much better of the room is well treated. The quality of electronics has some effect, though you may disagree with that. Often one has to use music material that actually shows differences. That's the case for instance with MP3. You need material to hit the heigh tones clearly if of you are going to hear the difference between 256/320 kbps and lossless. IF not, they will sound the same.
I also believe the listeners references or the fact that get to listen to both before a blind test can matter.
And obviously the listeners all need to listen in the best position. I've seen blind tests were listeners sat around the room. That certaintly isn't optimal.
The fact that the participants can get fatigued when listen back and forth many times could also matter. I wouldn't outrule it and believe using less rounds and with a break between would be better then going for 10/12 times in a row.
Other factors that could matter are EQ of the drivers and the horn itself.
I certaintly don't take audiophiles subjective experiences as proof of anything, but it's hard to believe the result you are sharing between these drivers. If it's right, it either means all audiophiles who have come to other conclusions are all wrong and deluted by placebo or it could mean that it's only the case with your spesific speaker.
Either way, the question first and foremost is if the blind test was conducted in such matter that it's really trustworthy.
Genelec which you are refering is 3way. We also have not any data, but just as speculation, unless they had driver with custom pp and custom or noexisted throat - that wide wg cant have very good pattern control. Its too wide.
Btw 3way is ok but its just different set of problems.
Btw 3way is ok but its just different set of problems.
Omholt
I am disinclined to go over this again. I've given these results many times before and I believe they are on my website.
You have listed all of the reasons that you won't believe the results. That's fine. Don't believe them. I don't really care. They were eye opening to me at the time. Now I understand that people will believe what they want to believe no matter what you do.
Mylar = Beryllium?
Which TAD unit on what horn?
If the horn used with TAD was designed for the DE250, then the horn most likely was masking the TAD's superiority.
Were the auditors hearing acuity tested beforehand?
If so, what was it?
Could be 30 regular rock concert attendies.
Regards,
WHG
Its an interesting driver concept. But I keep coming back to the test that we did comparing a mega-buck TAD with a DE250 in an identical system design. The results indicated that the two systems were statistically the same (some 30 listeners in blind tests). So I just do not see a "new" driver making all that much difference.
Which TAD unit on what horn?
If the horn used with TAD was designed for the DE250, then the horn most likely was masking the TAD's superiority.
Were the auditors hearing acuity tested beforehand?
If so, what was it?
Could be 30 regular rock concert attendies.
Regards,
WHG
***
We have the similar with blind tests of amps. Some seem to show differences, others give a null result.***
Do you have any examples of published tests coming to the former result?
the TAD 4002 and the B&C 250 don't sound the same regardless of this manufacture gedlee saying otherwise. If they sound the "same" that tells me the manufacture does not conduct proper tests . I saw one test with compression drivers where they tortured the participants with insane levels of a 15 second cut of some hideous pop music to get the results they wanted.
I do this thread to help people to understand waveguide technology.
I will not respond to queries that question my credibility and integrity.
I will not respond to queries that question my credibility and integrity.
JBL M2 has also the new D2 driver which obviously is a critical component to match with the new waveguide. Any speaker is a buch of comprmises!
I'm surprised how cheap they are.
I'd expected that it would be in TAD territory, but one just went for $750 on eBay, and there's another one at $250 right now:
JBL Professional D2430K D2 Dual Diaphragm Dual Voice Coil Compression Driver | eBay
That's hardly cheap, but considering that I paid $150 for my BMS 4540s, that's really not too bad. You have to spend a lot of money to get another octave, and the fact that these can be had for less than $1000 each is surprising.
(Keep in mind, there's almost no reason to drop $2000 on a pair of compression drivers unless you absolutely positively gotta have five octaves of bandwidth from one driver. If you can live with four octaves of bandwidth, there are plenty of good options under $300 a pair.)
the TAD 4002 and the B&C 250 don't sound the same regardless of this manufacture gedlee saying otherwise. If they sound the "same" that tells me the manufacture does not conduct proper tests . I saw one test with compression drivers where they tortured the participants with insane levels of a 15 second cut of some hideous pop music to get the results they wanted.
I love how people put opinions on the internet with zero data to back up their position.
You may not *agree* with the outcome of Geddes research, but to dismiss it without any data to back up your own argument is just flawed logic.
"Subjective Testing of Compression Drivers", by Earl R. Geddes, Lidia W. Lee, and Roberto Maggalotti.
In it, you state flat out in the Summary and Conclusions section: " ..nonlnear distortion in a compression driver is simply not a factor in it's sound quality."
I think that these are some pretty bold statements, and should be considered quite carefully before anyone would accept them as some sort of fact.
You seem to be basing your statements on the subjective listening test you performed as the subject of the engineering report. However, I was shocked and appalled at how incomplete and sketchy the details were for this controversial result.
There were several things that leaped out at me when I read this report.
Primarily, the biggest one was there was no information on the details of the listening test subjects: how many there were, who they were, the extent of their listening test training (if any), how the listening test data was organized, if it was averaged across the entire listening subject population, or if individuals were looked at for individual statistical significance, etc. In other words, we only get to see the final result of whatever you choose to present, without any details on the inner worings. This is not typical of serious articles on listening test results, it is more typical of casual listening test reports that aren't meant to be considered as evidence.
As one of your results, you state that a p=0.203 was indicative of no significant differences for level, yet this amount would mean that there had been some amount of correlation, and that one could expect these results to come up due to random chance every 5th listening test. However, if this kind of result came up more often than 1 in 5 times, it could be considered as potentially significant. Since we do not know how many listening subjects were lumped together to reach this statistic, it could be the simple case that sensitive listeners were lumped in with the entire listening population. Or not, but we simply don't know from the contents of the paper.
Secondarily, a big assumption was made that checking distortion on the compression driver at (or near) full power (approx. 100W, 28 V of drive stated), and then just around 3 dB down from that and only another 3 dB down from that, were the best levels to use. These levels exclude where most of the listening occurs, at power levels of a few watts and below. The distortion changes as shown in Fig. 1 as you went from 28 to 20 to 14 V of drive level, were in the range of -20 to -25 dB in the bottom of the driver's range, to around -12 to -18 dB for the upper portion of the driver's frequency range.
These translate to distortion levels of 10% and 25% respectively, a large amount of distortion at any of these elevated drive levels. Yet if I understand the listening test correctly, it was these levels that were compared to one another to see if they sounded any different from one another. At these levels of distortion, wouldn't everything tend to sound the same, since there would only be small changes in the distortion at these power levels, and no opportunity to compare against lower power levels where most real world listening is done? This seems like stacking the deck in a most aggressive way, such that it would virtually guarantee that there would be no significant difference between the different drive levels tested. Aside from the absolute levels used, having level changes of roughly only 3 dB and 6 dB are actually very small changes in operating levels, this also begs the question of why were such small steps choosen.
Other important issues concerning the listening test details need to be addressed as well: was there any form of control for these tests? In other words, just how sensitive were these listening tests, what were they inherently capable of detecting? If no controls were run, then the only thing that can be said, is that they appear to have detected the frequency response deviations from driver to driver as audible. Given that we do not even know what those deviations are, we can not even use this information to decide how sensitive the listening test was, we have zero information given in the paper on just how sensitive these listening tests actually were.
Since I myself have conducted and participated in controlled listening tests, I know how hard it can be to hear past all the procedure and hoopla, the mechanics of "taking the test", so I find myself concerned about several of the other details that were given in the engineering report. The source material consisted of just one 15 second musical segment, 15 seconds from "Burning Down the House (live), by the Talking Heads. This was the sole piece of music used to determine whether or not the musical segments being presented for evaluation were the same or not. I find this single source of stimulus being used as utterly amazing, as if we can all hang our hats on this one snippet of a pop rock cut!
It is common practice to use more than one song for serious listening tests, just to make sure that the musical segment did not fail to excite the potential sonic differences. Then, on top of that, it is only 15 seconds long. This is a relatively short periood of time, and even if it were carefully chosen to be as "busy" as possible, this is still not a lot of musical information to be making judgements on.
In my own experiences with listening tests, it takes a certain minimum amount of time to "latch on" to what is going on sonically, that is, you can not instantly begin to determine what sounds different, it takes some mental ledgerdomain and analysis to begin to notice what is actually going on. With a 15 second segment, you would be just about settling in, and WHAM, it's over. This would not lend itself to being able to detect subtle differences at all. Rapid short comparison pieces are typically used for CODEC testing, because they can be selected to highlight one particular misbehavior of the CODEC, but these same short segments are NOT very good for general purpose listening tests, as they do not explore all the possible problems or sonic issues.
Adding to this, it seems that the minimum number of comparisons was 27 of these 15 second segments repeated twice? If the listening subject failed to achieve a certain amount of consistency, then apparently, you made them listen to more comparisons, up to as many as a total of 45 paired comparisons? This is approx. 13 1/2 minutes of serious and hard listening for just the 27 pairs, but if you had to go the full 45 pairs, that's 22 1/2 minutes of sheer listening.
In my own experiences, it is hard to continue past about 10-15 minutes of hard serious listening at one sitting, after that, listening fatique set's in, and the results tend toward random. Your amount of time spent listening is border line here, and this combined with the additional stress of trying to analyze such a short segment, would tend to reduce the sensitivity of the listening subjects.
There were other concerns as well, the use of a Turtle Beach Santa Cruz sound card as a playback and recording device, where it played the test cut, recorded the output of one of the compression drivers, and then played it back for the listening test. Thus the test signal passed through the sound card three times, out and in and out again, before it was finally heard by the listening subject.
I also question the use of a Crown Macro-Tech 5000VZ to drive the compression drivers, this is a 5000W power amp typically used to drive subwoofers to deafening levels. Such high power amplifiers are usually NOT known for their finesse in driving tweeters, or high resolution full range speakers with the utmost delicacy. More probable loss of resolution capability.
So it looks to me like there were many steps that were not taken to maximize the resolving power of the listening test, no steps taken to determine what resolving power the listening test actually had, and no way of knowing if this particular listening test could have detected the difference between an 8 track tape and an SACD, or between anything else.
But let's put all of that aside, let's look at just the result of the listening test: statistically significant results for driver to driver differences (assumed to be only differences in frequency response), but a failure to achieve statsticaly significant differences with drive level changes. This is merely a failure to achieve the pre-selected level of statistical significance, and nothing else. But wait, you are not merely stating the factual and scientific conclusion of the test results, you are doing an additional thing: you are taking a null result (a failure to achieve positive results), and claiming that it was a negative, that there WERE no differences due to level. Then, you take this and further embellish it by stating that this means that there were no differences due to non-linear distortion.
Even if we ignore all of the above voiced concerns and accept the assumptions made by the experimenter, we still can not turn a simple null into a very specific iron clad negative. This is NOT true science, it is not accepted practice amoung statisticians, it is not accepted anywhere as a valid way of looking at test results, except by folks with an agenda in hand.
I question these results so strenuously, because they go against my considerable experience, both professionally with compression driver distortion, and as a practitioner of controlled listening tests over the details of the listening test itself.
I find it distressing that the AES would allow this engineering report to be published with the wording it contains, that of a solid and certain negtative result, when it would be a tottering house of cards anywhere else.
I reject your conclusions as stated, and feel that this engineering report does a grave disservice to the audio community, as well as the engineering community, due to the exaggerated nature of the results as explained.
My parts come out just fine and they cost me far less than you can imagine. There is a big advantage to doing everything yourself. People these days seem to loose sight of that.
Did you see this?
An externally hosted image should be here but it was not working when we last tested it.
Gedlee speakers in polyurethane
An externally hosted image should be here but it was not working when we last tested it.

Avantgarde Zero in polyurethane
More info:
Avantgarde Zero 1 and Uno Fino - High End 2013 Munich - The Audio Beat - www.TheAudioBeat.com
Primarily, the biggest one was there was no information on the details of the listening test subjects: how many there were, who they were, the extent of their listening test training (if any),
From the paper:
2.3 Subjects
Twenty-seven college students were recruited for the experiment. All subjects passed an audiometric
screening test at 25 dB HL (ANSI, 1989) for 250, 500, 1000, 2000, and 4000 and 8000 Hz. All subjects
were paid for their participation.
2.4 Test Protocol
A computer program was written in Visual Basic to facilitate the presentation of the stimuli, the
recording of the data, and the tracking of the stability of the responses. First, the program presents a short
training section where the subjects were given some contrived examples along with the suggested ratings,
followed by the formal test.
During the formal test, each subject is presented with a stimulus selected at random and played from
the beginning to the end (15 sec). After the complete presentation, the subject can give a rating or they
can do a direct real time A-B comparison of the reference stimulus and the test stimulus.
So I should take seriously the rest of your critique?
- Home
- Loudspeakers
- Multi-Way
- Geddes on Waveguides