LTspice models for Sanken 2SC3264/A1295
- By keantoken
- Software Tools
- 22 Replies
I made these models partly to test out some changes I've made in how I go about creating models.
Note that the 3264/1295 are the same chip as the 3263/1294, just in a different package. The MT-200 versions are typically unobtanium.
.model 2SC3263-Y_kq npn ; Revision 4 by keantoken - Feb 27 2019
+ Bf=84 Vaf=150 Is=1.8p Cjc=600p Cje=15n Tf=2.2n
+ Rb=.22 Rbm=0 Irb=200m Re=38m
+ Rc=1m Rco=750m Vo=1000 Gamma=24n Qco=100p quasimod=1
+ Br=8 Ise=16p Ikf=1000 Nk=0.2
+ Itf=10 Xtf=100 Vtf=0.8 Xtb=1.4
+ Vceo=230 Icrating=15A mfg=Sanken
.model 2SA1294-Y_kq pnp ; Revision 3 by keantoken - Feb 27 2019
+ Bf=90 Vaf=150 Is=60f Cjc=1.2n Cje=20n Tf=3.9n
+ Rb=1.4 Rbm=0 Irb=3 Re=33m
+ Rc=8m Rco=380m Vo=1000 Gamma=160p Qco=100p quasimod=1
+ Br=8 Ise=0 Ikf=22 Nk=0.5
+ Itf=10 Xtf=100 Vtf=0.8 Xtb=1.7
+ Vceo=230 Icrating=15A mfg=Sanken
.model 2SC3264-Y_kq npn ; Revision 4 by keantoken - Feb 27 2019
+ Bf=84 Vaf=150 Is=1.8p Cjc=600p Cje=15n Tf=2.2n
+ Rb=.22 Rbm=0 Irb=200m Re=38m
+ Rc=1m Rco=750m Vo=1000 Gamma=24n Qco=100p quasimod=1
+ Br=8 Ise=16p Ikf=1000 Nk=0.2
+ Itf=10 Xtf=100 Vtf=0.8 Xtb=1.4
+ Vceo=230 Icrating=17A mfg=Sanken
.model 2SA1295-Y_kq pnp ; Revision 3 by keantoken - Feb 27 2019
+ Bf=90 Vaf=150 Is=60f Cjc=1.2n Cje=20n Tf=3.9n
+ Rb=1.4 Rbm=0 Irb=3 Re=33m
+ Rc=8m Rco=380m Vo=1000 Gamma=160p Qco=100p quasimod=1
+ Br=8 Ise=0 Ikf=22 Nk=0.5
+ Itf=10 Xtf=100 Vtf=0.8 Xtb=1.7
+ Vceo=230 Icrating=17A mfg=Sanken
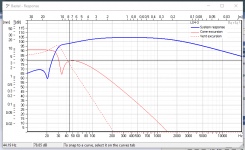
These models were fitted mainly to the Ic vs Vce chart, which includes quasi-saturation and gives better overall accuracy even though the fit to the Hfe vs Ic chart may not look excellent. The fact is a model that fits the Hfe chart perfectly is actually likely to be a poor model overall.
Apparent deficiencies of these models:
Hfe is too high in high-current deep saturation, as the Vo parameter seems to be doing the opposite of what it should. Hence Vo has been made too high to interfere.
Vaf (Early voltage) is not accurate. It is a best guess as there is no data.
It's been suggested that Rb/Re/Rc are incorrect even though I got the best fit to the data with the current combinations.
Qco determines the slowdown due to quasi-saturation, but I don't know the best way to determine this parameter. So I've set it to a low value, which will in theory be better than not at all.
I can improve the model if someone can take measurements:
Cbe and Cbc values, and perhaps at multiple bias levels.
Vaf measurements as the current values are are only educated guesses.
Note that the 3264/1295 are the same chip as the 3263/1294, just in a different package. The MT-200 versions are typically unobtanium.
.model 2SC3263-Y_kq npn ; Revision 4 by keantoken - Feb 27 2019
+ Bf=84 Vaf=150 Is=1.8p Cjc=600p Cje=15n Tf=2.2n
+ Rb=.22 Rbm=0 Irb=200m Re=38m
+ Rc=1m Rco=750m Vo=1000 Gamma=24n Qco=100p quasimod=1
+ Br=8 Ise=16p Ikf=1000 Nk=0.2
+ Itf=10 Xtf=100 Vtf=0.8 Xtb=1.4
+ Vceo=230 Icrating=15A mfg=Sanken
.model 2SA1294-Y_kq pnp ; Revision 3 by keantoken - Feb 27 2019
+ Bf=90 Vaf=150 Is=60f Cjc=1.2n Cje=20n Tf=3.9n
+ Rb=1.4 Rbm=0 Irb=3 Re=33m
+ Rc=8m Rco=380m Vo=1000 Gamma=160p Qco=100p quasimod=1
+ Br=8 Ise=0 Ikf=22 Nk=0.5
+ Itf=10 Xtf=100 Vtf=0.8 Xtb=1.7
+ Vceo=230 Icrating=15A mfg=Sanken
.model 2SC3264-Y_kq npn ; Revision 4 by keantoken - Feb 27 2019
+ Bf=84 Vaf=150 Is=1.8p Cjc=600p Cje=15n Tf=2.2n
+ Rb=.22 Rbm=0 Irb=200m Re=38m
+ Rc=1m Rco=750m Vo=1000 Gamma=24n Qco=100p quasimod=1
+ Br=8 Ise=16p Ikf=1000 Nk=0.2
+ Itf=10 Xtf=100 Vtf=0.8 Xtb=1.4
+ Vceo=230 Icrating=17A mfg=Sanken
.model 2SA1295-Y_kq pnp ; Revision 3 by keantoken - Feb 27 2019
+ Bf=90 Vaf=150 Is=60f Cjc=1.2n Cje=20n Tf=3.9n
+ Rb=1.4 Rbm=0 Irb=3 Re=33m
+ Rc=8m Rco=380m Vo=1000 Gamma=160p Qco=100p quasimod=1
+ Br=8 Ise=0 Ikf=22 Nk=0.5
+ Itf=10 Xtf=100 Vtf=0.8 Xtb=1.7
+ Vceo=230 Icrating=17A mfg=Sanken
These models were fitted mainly to the Ic vs Vce chart, which includes quasi-saturation and gives better overall accuracy even though the fit to the Hfe vs Ic chart may not look excellent. The fact is a model that fits the Hfe chart perfectly is actually likely to be a poor model overall.
Apparent deficiencies of these models:
Hfe is too high in high-current deep saturation, as the Vo parameter seems to be doing the opposite of what it should. Hence Vo has been made too high to interfere.
Vaf (Early voltage) is not accurate. It is a best guess as there is no data.
It's been suggested that Rb/Re/Rc are incorrect even though I got the best fit to the data with the current combinations.
Qco determines the slowdown due to quasi-saturation, but I don't know the best way to determine this parameter. So I've set it to a low value, which will in theory be better than not at all.
I can improve the model if someone can take measurements:
Cbe and Cbc values, and perhaps at multiple bias levels.
Vaf measurements as the current values are are only educated guesses.