Hi Francesco,
try to replace in line 129
by
and remove all the "create bins" stuff from line 160 to 181
and compile it again.
Note: This is untested. No guarantee.
Note2: The Spectrum Size you wished is 32.
Kind regards
Tobias
try to replace in line 129
Code:
unsigned int bins[spectrum_size+1];by
Code:
unsigned int bins[] = {1, 2, 3, 4, 5, 6, 7, 8, 9, 10, 11, 12, 13, 14, 15, 16, 17, 18, 22, 26, 31, 36, 43, 51, 61, 72, 86, 102, 121, 144, 170, 202, 240};and remove all the "create bins" stuff from line 160 to 181
and compile it again.
Note: This is untested. No guarantee.
Note2: The Spectrum Size you wished is 32.
Kind regards
Tobias
Thank you very much, Tobia.
I have tried and it is much better than the previous one.
I have 2 questions:
1. How can you calculate the numbers you suggested? So if you change something, I don't need to bother you.
2. How can I exclude any window options? It seems to me that 2 of the 3 options create a lot of noise on all frequencies.
Thanks again and greetings,
Francesco
Sorry, Tobias.
The first question is:
How can you calculate the numbers you suggested? So if I would like to change something, I don't need to bother you.
Thanks again and best regards,
Francesco
The first question is:
How can you calculate the numbers you suggested? So if I would like to change something, I don't need to bother you.
Thanks again and best regards,
Francesco
Hi,
the result of the fftw-algorithm are 256 frequency bins (+1 DC). They are equal distributed. The maximum frequency is sample_rate/2, eg. 22.05kHz for 44.1kHz sample rate.
So the first frequency is
22050Hz / 256 ~= 86 Hz
The second is 2x the first:
2x 22050Hz / 256 = 172Hz
and so on.
The numbers represent the indices used for calculation. E.g.:
bins = {1, 2, 3, 5, 9}
returns values for frequencies:
m=0:
x = 1 .. x < 2
amplitudes summed for
f=f(1) = 86Hz
m=1:
x = 2 .. x < 3
amplitudes summed for
f = f(2) = 172Hz
m=2:
x = 3 .. x < 5
amplitudes summed for
f = f(3) = 258Hz and f = f(4) = 345Hz
m=3:
x = 5 .. x < 9
amplitudes summed for
f = f(5) = 431Hz up to f = f(8) = 689Hz
I hope I could clarify more than I caused confusion...
Kind regards,
Tobias
the result of the fftw-algorithm are 256 frequency bins (+1 DC). They are equal distributed. The maximum frequency is sample_rate/2, eg. 22.05kHz for 44.1kHz sample rate.
So the first frequency is
22050Hz / 256 ~= 86 Hz
The second is 2x the first:
2x 22050Hz / 256 = 172Hz
and so on.
The numbers represent the indices used for calculation. E.g.:
bins = {1, 2, 3, 5, 9}
returns values for frequencies:
Code:
for(x = bins[m]; x < bins[m+1]; x++)m=0:
x = 1 .. x < 2
amplitudes summed for
f=f(1) = 86Hz
m=1:
x = 2 .. x < 3
amplitudes summed for
f = f(2) = 172Hz
m=2:
x = 3 .. x < 5
amplitudes summed for
f = f(3) = 258Hz and f = f(4) = 345Hz
m=3:
x = 5 .. x < 9
amplitudes summed for
f = f(5) = 431Hz up to f = f(8) = 689Hz
I hope I could clarify more than I caused confusion...
Kind regards,
Tobias
Hi Tobias, hi everyone,
after numerous and thorough tests I am pretty sure I can say that my opinion is that:
1. The frequency spectrum sent by peppyalsa ends at 44100 and not 22050 (such as try using "logarithmic_frequency 0" and only half of the values sent will be different from 0).
2. The "Window function for FFT" cannot be avoided (such as try using "window 0" and try to listen to a fixed frequency signal such as a 1000Hz sine wave and you can notice many of the values sent will be other than 0).
I would be very happy if you could give me your point of view on the items just described.
Forgive me if I am too pushy and pressing.
Thanks for everything and have a nice weekend,
Francesco
Hi Francesco,
thanks for sharing your opinion.
1.
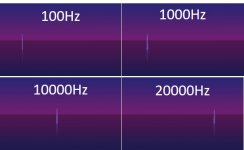
The FFT always ends at the half of your sample rate. If the sample rate is 44100Hz, the upper most frequency is 22050Hz. For confirmation you can check it on e.g. on a PeppyPlayer, see attachment. What is your sample rate?
2. You can disable the windowing be setting it to any other number than 1, 2 or 3, as the windowing is only applied if it is set to one of these numbers:
Maybe your input signal is not a pure sine wave. Clipping can cause additional frequency responses. Have you tried a not so "loud" version of your test sample?
Kind regards
Tobias
thanks for sharing your opinion.
1.
The FFT always ends at the half of your sample rate. If the sample rate is 44100Hz, the upper most frequency is 22050Hz. For confirmation you can check it on e.g. on a PeppyPlayer, see attachment. What is your sample rate?
2. You can disable the windowing be setting it to any other number than 1, 2 or 3, as the windowing is only applied if it is set to one of these numbers:
Code:
		if (window_function == 1) {input_buffer[buffer_index] = input_buffer[buffer_index] * hann[buffer_index];}
		if (window_function == 2) {input_buffer[buffer_index] = input_buffer[buffer_index] * hamm[buffer_index];}
		if (window_function == 3) {input_buffer[buffer_index] = input_buffer[buffer_index] * black[buffer_index];}
Maybe your input signal is not a pure sine wave. Clipping can cause additional frequency responses. Have you tried a not so "loud" version of your test sample?
Kind regards
Tobias
Attachments
Francesco, can you share the testing file which you use and the output (screenshot) which you observe? That would help to reproduce the issue (if any).
Thanks in advance!
Thanks in advance!
Hi all,
@ Tobias:
point 1: you are right I am using 96Khz.... I will try at 48 or 44.1
point 2: I am sure that i tried at 50% of loud (the signal is at 0dB)
@ rpi:
you can see the results already reported on the post # 492.
The sources I used are FLAC files generated from a CD (very big) let me know if you want to test them: I will try to share.
Thank you very much (to both of you),
Francesco

Hello to all,
I would like to avoid boring or even annoying with my comments.
1. regarding the first point, I tried, as you advised, to use a "sample rate" at 44100 and 48000 and, as I was sure, the last frequency displayed is around 20kHz. But my point of view is: if I use high "sample rate" values, what I expect is to see the frequencies that are normally audible, among other things, as a display, I believe that even using 44100 the arrangement of the frequencies is very limited for the mid-bass while it is very wide for the highs. If you remember, in post # 500 I hypothesized an arrangement that, in my opinion, could be fine as fixed, even when using high sample rates (192k, 384k, 762k). I tried with the fixed declaration but, not being able to use decimals, the low frequencies are collapsed into very few positions.
2. I tried again with the sinusoidal signals (which I am attaching) with 100%, 75%, 50% and 25% amplitude and the result, especially for low frequencies, is that with any "window" value it is never reached 1 or at most 2 bars and in any case the closest result is the one with "window" 3; with 0 it seems to me the worst.
To make sure my tests were not affected by my program, I used "ConsoleSpectrum.py". It should be noted that I have achieved the best results using:
logarithmic_frequency 1
logarithmic_amplitude 1
Thanks for your attention and best regards to everyone.
PS: obviously my comments are aimed at having a product (for the spectrum) at least comparable to the beautiful "VU-Meters" available in PeppyMeter.
Hi Francesco,
your comments are always welcome. It is good to see that others also like the stuff one does.
The "resolution" of the frequencies depends on the number of samples you use for your FFT and the sample rate, as I tried to explain in post #504. If you increase the sample rate, the width of the frequency-bins also increases. In other words: You can reduce the sample rate or increase the number of samples used for the FFT, which increases the calculation time and memory usage.
Kind regards
Tobias
Hi everyone,
I wish to share the current level of integration that I am achieving.
A kind comment from all those who wish it will be really appreciated.
Sincerely and thanks,
Francesco
Video test
I wish to share the current level of integration that I am achieving.
A kind comment from all those who wish it will be really appreciated.
Sincerely and thanks,
Francesco
Video test
Hi Francesco,
It looks very good! I think you created the first custom Spectrum UI which is using peppyalsa plugin. Which language did you use to write that UI?
Another way to display volume and spectrum at the same time is to use either large or wide screen, something like the one mentioned in this post:
https://www.diyaudio.com/community/threads/nas-streamer.360380/post-6543671
Best regards
Thanks, RPI.
It's a prototype phase: I have to optimize the software. I am using Python. Unfortunately I had to use Cava for the spectrum because 2 main reasons: not to change the frequency as the sample rate changes and the spacing between the frequency (x axis)
Thanks again and best regards,
Francesco
It's a prototype phase: I have to optimize the software. I am using Python. Unfortunately I had to use Cava for the spectrum because 2 main reasons: not to change the frequency as the sample rate changes and the spacing between the frequency (x axis)
Thanks again and best regards,
Francesco
Dear RPI,Thanks, RPI.
It's a prototype phase: I have to optimize the software. I am using Python. Unfortunately I had to use Cava for the spectrum because 2 main reasons: not to change the frequency as the sample rate changes and the spacing between the frequency (x axis)
Thanks again and best regards,
Francesco
I am trying to use Peppy's spectrum and, preparing the environment, I realized that following the peppymeter installation instructions, in particular with the command "sudo apt-get install python3-pygame" does not download the correct version of pygame.
I personally solved it by using "sudo apt update --allow-releaseinfo-change". could it be the case to update the documentation?
Best regards,
Francesco
Hi Francesco,
What do you mean saying 'correct version of pygame'? Do you mean that apt-get installs Pygame 2?
I didn't test PeppyMeter with Pygame 2. It will probably work without any changes.
Best regards
What do you mean saying 'correct version of pygame'? Do you mean that apt-get installs Pygame 2?
I didn't test PeppyMeter with Pygame 2. It will probably work without any changes.
Best regards
Hi Francesco,
Do you mean that if you don't have Pygame installed on your OS then using commands:
sudo apt update --allow-releaseinfo-change
sudo apt-get install python3-pygame
will install Pygame of version 1.9.4? I'm not sure how it works. How does it know that you don't want to install Pygame 2 which is the latest?
Thank you!
- Home
- Source & Line
- PC Based
- PeppyMeter