using a PC83 as a tweeter
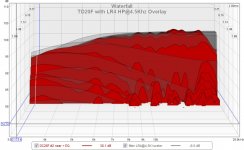
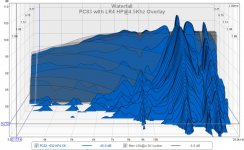
I connected the PC83 fullrange to the HP output to compare it to a TD20. I would expect a tweeter to make a better tweeter, but was interested to see the comparison. Both measurements are same distance and EQ'd flat to match the LR4 curve. The LR4 is added as an overlay in both.
I connected the PC83 fullrange to the HP output to compare it to a TD20. I would expect a tweeter to make a better tweeter, but was interested to see the comparison. Both measurements are same distance and EQ'd flat to match the LR4 curve. The LR4 is added as an overlay in both.
Attachments
PC83 as a midrange
The PC83 makes a much better midrange than a tweeter. Graphs show changes from no EQ, to EQ, to EQ + phase correction.
Looking for alternate midranges, probably a Dayton RS52AN.
The PC83 makes a much better midrange than a tweeter. Graphs show changes from no EQ, to EQ, to EQ + phase correction.
Looking for alternate midranges, probably a Dayton RS52AN.
Attachments


RS52AN dome midrange
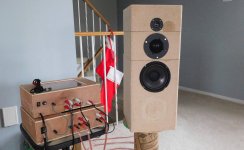
I picked up a couple of RS52AN (2" AL dome) to compare to the PC83 (3" poly cone).
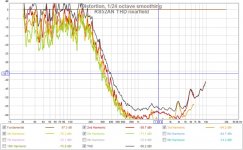
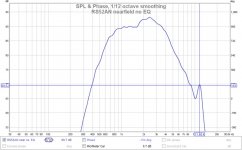
The raw RS52AN driver response + LR4 BP and THD are the 2nd & 3rd graphs. The amp was used to SPL level out the sensitivity differences with the woofer and tweeter. The RS52 has surprisingly low distortion and it sounds detailed and clear.
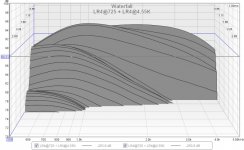
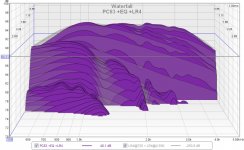
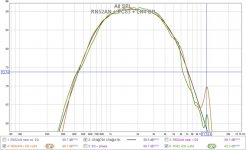
After EQ both drivers follow the LR4 BP fairly closely (pic#4) and their waterfalls (pic#5,6) are also very close and without issues. The dome sounds better IMO but its hard to get that from the graphs.
I picked up a couple of RS52AN (2" AL dome) to compare to the PC83 (3" poly cone).
The raw RS52AN driver response + LR4 BP and THD are the 2nd & 3rd graphs. The amp was used to SPL level out the sensitivity differences with the woofer and tweeter. The RS52 has surprisingly low distortion and it sounds detailed and clear.
After EQ both drivers follow the LR4 BP fairly closely (pic#4) and their waterfalls (pic#5,6) are also very close and without issues. The dome sounds better IMO but its hard to get that from the graphs.
Attachments
-
 RS52AN THD nearfield.jpg117.8 KB · Views: 221
 -
 RS52AN nearfield no EQ.jpg82 KB · Views: 360
 -
 DSCN7436r.jpg309.3 KB · Views: 373
 -
 RN52AN + PC83 + LR4 BP.jpg81.1 KB · Views: 251
 -
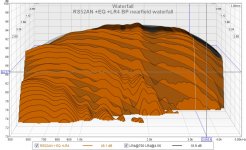 RS52AN +EQ +LR4 BP nearfield waterfall.jpg147.9 KB · Views: 263
 -
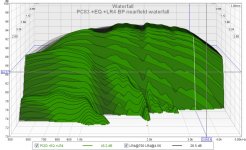 PC83 +EQ +LR4 BP nearfield waterfall.jpg142.9 KB · Views: 240
Looks very respectable Don. The PC83 as a tweeter graph shows your waterfall graphs are working as they should! Really shows up high freq resonances!!
Tony.
Tony.
Very nice results, using a good logical methodology ! Thx for sharing.
I love this kind of inexpensive learning project....IMO, learning is the real reward, even over better sound...heresy I know 🙂
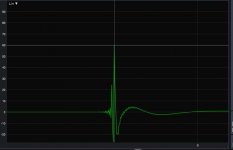
You found the same as i did, about the look of LR impulse responses.
Below's a summation of a 4-way crossover from a high-quality active x-over.
So electrical xover bands summed together only, no speaker involved.
Can only get worse looking with a speaker in play Lol
LR24's...100, 650, and 6300Hz xover freqs.
FWIW, the difference I've found between using FIR to correct a speaker's entire mag and phase output globally, vs correcting mag and phase driver-by-driver individually before then adding linear phase crossovers is:
Both methods can give near identical results tuned to one spot (usually on-axis).
Both can look near perfect.
But the global correction's measurements will fall apart off-axis (off the tuning spot), much more so than the driver-by-driver method.
Acoustic summation through x-over holds up considerably better at different angles, when adjacent drivers have a smooth phase relationship between each other.
I love this kind of inexpensive learning project....IMO, learning is the real reward, even over better sound...heresy I know 🙂
You found the same as i did, about the look of LR impulse responses.
Below's a summation of a 4-way crossover from a high-quality active x-over.
So electrical xover bands summed together only, no speaker involved.
Can only get worse looking with a speaker in play Lol
LR24's...100, 650, and 6300Hz xover freqs.
FWIW, the difference I've found between using FIR to correct a speaker's entire mag and phase output globally, vs correcting mag and phase driver-by-driver individually before then adding linear phase crossovers is:
Both methods can give near identical results tuned to one spot (usually on-axis).
Both can look near perfect.
But the global correction's measurements will fall apart off-axis (off the tuning spot), much more so than the driver-by-driver method.
Acoustic summation through x-over holds up considerably better at different angles, when adjacent drivers have a smooth phase relationship between each other.
Attachments
Looks very respectable Don. The PC83 as a tweeter graph shows your waterfall graphs are working as they should! Really shows up high freq resonances!!
Tony.
Thanks. I'm now finding CSD a useful view as it can find issues not detected by the FR.
The midrange FR and CSD for the PC83 and RS52 are very similar so I can't easily differentiate them graphically. I have a definite preference for the dome, so I'd like another measurement / test to show that difference. Suggestions ?
Very nice results, using a good logical methodology ! Thx for sharing.
I love this kind of inexpensive learning project....IMO, learning is the real reward, even over better sound...heresy I know 🙂.
Agreed. I like to understand the mechanisms and experience what makes a difference. It's easier for me to swap a driver and compare them without the time and effort of an entire cabinet build each time.
You found the same as i did, about the look of LR impulse responses.
Below's a summation of a 4-way crossover from a high-quality active x-over.
So electrical xover bands summed together only, no speaker involved.
Can only get worse looking with a speaker in play Lol
LR24's...100, 650, and 6300Hz xover freqs.
FWIW, the difference I've found between using FIR to correct a speaker's entire mag and phase output globally, vs correcting mag and phase driver-by-driver individually before then adding linear phase crossovers is:
Both methods can give near identical results tuned to one spot (usually on-axis).
Both can look near perfect.
But the global correction's measurements will fall apart off-axis (off the tuning spot), much more so than the driver-by-driver method.
Acoustic summation through x-over holds up considerably better at different angles, when adjacent drivers have a smooth phase relationship between each other.
That's good to know, Many people also do measurement averaging over the listening area (couch) and get an averaged correction and not a spot perfect correction. I separated my SPL correction from the unity gain phase correction so I can see how sensitive I am to less than perfect IR / Step. response.
I have a definite preference for the dome, so I'd like another measurement / test to show that difference. Suggestions ?
The only thing I can think of is doing horizontal polars through 180 deg (small steps like 10deg). You may find the one you prefer is more consistent off axis.
It's quite tricky doing them, and if you are doing it in room I suspect even harder to get valid results. I did mine outside, and even then it was a real challenge, and the measurements past about 120deg were dubious..
What you are looking for is a nice even following of the on axis FR in each subsequent off axis measurement. If you get big fluctuations and overlapping response curves then that's probably not a good sign.
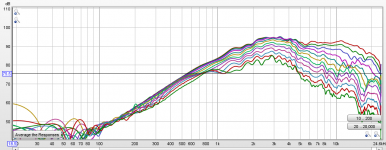
Attached is a graph of one of my DMS37 tweeters on axis through 110 deg off axis (in 10 deg increments). It seems reasonably well behaved I think.
One important thing is when you are rotating the speaker it needs to be rotating as if the centre is flush with the baffle and running down the centre of the baffle (if that makes sense).
I made my own rotating speaker stand, but it has some issues, mainly with tilt when the weight shifts due to rotation (center of rotation flush with the baffle presents some challenges!)
Tony.
Attachments
nDo and Tony,
I agree with Tony. But I.m.o. the off axis measurements should be made filtered in box and then overlaid to see what the differences exist between the dome and cone mid.
One physical difference may be radiating surface, which -at first glance- seems a bit smaller for the dome.
And how about sighted bias regarding preference for the dome? Most of us are familiar with the almost perfect on axis measurements of the RS52 and its sturdy built quality. That may easily influence sighted, subjective preference.
Eelco
The only thing I can think of is doing horizontal polars through 180 deg (small steps like 10deg). You may find the one you prefer is more consistent off axis.
<snip>
One important thing is when you are rotating the speaker it needs to be rotating as if the centre is flush with the baffle and running down the centre of the baffle (if that makes sense).
<snip>
Tony.
Makes sense, you want to rotate about the baffle plane. I would need to build a fixture, but that's easy enough. I've been listening on axis and close enough to swamp the room (I think). Still, it would be worth measuring. Thanks.
nDo and Tony,
I agree with Tony. But I.m.o. the off axis measurements should be made filtered in box and then overlaid to see what the differences exist between the dome and cone mid.
One physical difference may be radiating surface, which -at first glance- seems a bit smaller for the dome.
There may be something about how they radiate. I'm not sure if they both act like pistons in the range I'm using. A polar measurement may reveal that. The cone is 3" and the dome is 2" and nether should be beaming at these freq.
And how about sighted bias regarding preference for the dome? Most of us are familiar with the almost perfect on axis measurements of the RS52 and its sturdy built quality. That may easily influence sighted, subjective preference.
Eelco
Always a possibility, its not the first time I picked beauty first 🙂. I'd have to build a second unit and script a blind ABX test to be sure. I'm not attached to either driver and in the previous tweeter tests I preferred the cheaper smaller less attractive TD20 over the DC28 and those CSDs were similar as well.
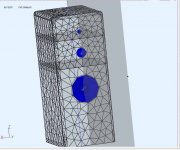
I had some time to start an ABEC3 model of this speaker so I can compare/adjust the field shapes from the entire speaker. The ABEC model is modular just like the sandbox and includes the active 3way XO [725Hz, 4550Hz]. This model does not have interior box modelling for the TD20F tweeter or RS52AN midrange boxes because these drivers have sealed backs.
Attachments
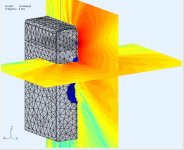
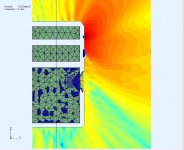
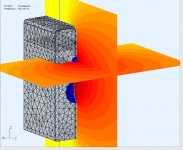
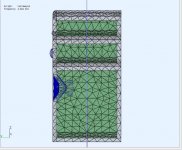
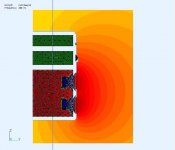
I'm trying a few sims trying to understand why I prefer a midrange dome to the cone even when I can make their FRs equal. These pics are speaker cross sections with wavefronts at the XO 725Hz.
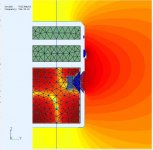
The first is uses the cone with the rear chamber so its sim'd as well. The dome has a closed rear chamber so just the front is sim'd. They both look fine.
Maybe its the polars that are difference.
The first is uses the cone with the rear chamber so its sim'd as well. The dome has a closed rear chamber so just the front is sim'd. They both look fine.
Maybe its the polars that are difference.
Attachments

Last edited:
Interesting Don! I'd looked at ABEC before but never tried to sim anything (I have played with akabak).
The dispersion at 725hz looks excellent, 5Khz in the first post is starting to look a bit less so. How long did it take you to get up to speed using abec?
Tony.
The dispersion at 725hz looks excellent, 5Khz in the first post is starting to look a bit less so. How long did it take you to get up to speed using abec?
Tony.
Interesting Don! I'd looked at ABEC before but never tried to sim anything (I have played with akabak).
ABEC3 supports Boundary Elements (BE) and Lumped Elements (LE). The LE engine is very similar to (the son of ?) AKABAK. It's fairly easy to do the syntax fixes and get the older AKABAK scripts to run under ABEC3.
The dispersion at 725hz looks excellent, 5Khz in the first post is starting to look a bit less so. How long did it take you to get up to speed using abec?
Tony.
There are 3 tools required for this acoustic sim. The mechanical dwg is done in FreeCad [8hrs to learn basics], the mesh is created with GMSH [1hr for basics] and then ABEC3 [40hrs to learn basics]. There is an additional VACS tool [2hrs for basics] used by ABEC3 for plotting FR, polars, etc. It would take less time if there were a good video series on ABEC3 instead of deductive learning via it's examples. There is another thread on ABEC that has a good tutorial by Gaga. ABEC experts - help!
It seems that rounded corners on a box are sufficient at the low->mid freq, which is no surprise. The effort will be constructing a baffle shape to get clean integration with mid-high performance.
Woofer changes
I wanted better bass from the speaker without making it too big. The single 6.5" is OK for moderate listening levels. It does not go very low but I plan on using subwoofer(s) for that. The problem is that it sounds muddy (distortion) when I try to drive it to reasonable levels, but not uncomfortably loud. The problem is worse when I add a Linkwitz transform to extend the LF using this sealed box. The driver is flapping around too much.
First attempt is to add another 6.5inch driver in parallel. The back chamber is shared so the Qts goes from 0.9 to 1.1 (courtesy HornResp). This is higher than the 0.7 that I would normally aim for. Seems a bit more dynamic now and it fills the room better.
Definite improvement and more measurements will be posted.
Attachments

Thanks Don, It's a pretty steep leaning curve for the Abec as I suspected, but it looks like a very good tool to have in the arsenal!
It sounds like maybe you were running out of excursion with the woofers. Is the new config running them in series?
Tony.
It sounds like maybe you were running out of excursion with the woofers. Is the new config running them in series?
Tony.
Hello Don,
To be honest: I do not quite get how the ABEC pictures work. Is this a combination of modelling the baffle shape in combination with idealized cone/dome radiators placed in it?
If that assumption is correct, is there a way to import and use .frd plots instead of idealized drivers?
Eelco
To be honest: I do not quite get how the ABEC pictures work. Is this a combination of modelling the baffle shape in combination with idealized cone/dome radiators placed in it?
If that assumption is correct, is there a way to import and use .frd plots instead of idealized drivers?
Eelco
Thanks Don, It's a pretty steep leaning curve for the Abec as I suspected, but it looks like a very good tool to have in the arsenal!
It sounds like maybe you were running out of excursion with the woofers. Is the new config running them in series?
Tony.
The woofers are in parallel. These are budget woofers and I have seen this before, they get muddy when there is a lot of LF or at higher volumes. Going with 2 woofers @6.5in would be fine for 90% of my listening time. Maybe I need 4 woofers.... or maybe 8 inch woofers? 😀
ABEC or FEM/BEM simulations are the only way I know of to "see" the sound fields produced and it is a wonderful but complicated tool.
Hello Don,
To be honest: I do not quite get how the ABEC pictures work. Is this a combination of modelling the baffle shape in combination with idealized cone/dome radiators placed in it?
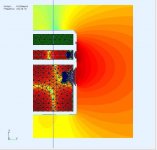
The pictures are SPL fields around the speaker (y=1m@right side) at a particular frequency. I was interested to see how the different midranges interacted with the woofer(s) and projected sound from the cabinet. The "red" level is +100db and "yellow" is around 80db and "blue" is 60db. I removed the outer case so you can see inside as well as outside the speaker. The simulation includes the XO, driver models, and cabinet construction (baffle roundovers included). The ABEC simulation itself uses BEM to solve the Helmholtz integral for each finite element (mesh triangle) pressure and velocity.
If that assumption is correct, is there a way to import and use .frd plots instead of idealized drivers?
Eelco
You can import data files like ZMA or FRD but these are usually done in an IEC baffle which is not what I have. You can also use data files from Klippel scans for membrane misbehaviour, but I don't have this data. The purpose of this BEM sim is to find what effect my baffle, driver placement, and filters have on the sound field. I wanted to see the entire field, and not just a point microphone measurement. There will be differences from actual driver(s) but these are not causing me any issues. ABEC can also generate other plots (FR, phase, Z, polar, contour, etc) depending on the analysis required.
I can provide you with the driver electrical model used:
Code:
Def_Driver 'DynavoxTC6028'     // 6.5inch paper woofer
  Re=6.8ohm			// datasheet
  Le=0.43mH			// datasheet
  Mms=13.9g  			// datasheet
  Cms=5.31e-4m/N		// HornResp derived
  Bl=6.367N/A			// datasheet
  Qes=0.84			// datasheet
  Qms=3.79			// datasheet
  Rms=1.35Ns/m	                // HornResp derived
  Fs=57Hz		         // datasheet
  SD=130cm2			// datasheet
The driver physical model is:
Code:
Diaphragm  "UpperWooferFront"   // Dynavox 6.5" woofer
  Meshing=Bifu
  DrvGroup=1001                // Driving group link to observation stage
  SubDomain=1                  // Front side belongs to sub-domain 1, exterior
  RefNodes="N"
  Position=2000,2001,2002      // Triangle locator giving position
  Shift=0,1cm,11cm
  Side=Front                    // Creates elements for diaphgragm front
  dD=140mm                     // Diameter of cone
  tD1=30mm                     // Inner depth of cone to base of dust cap
  dD1=50mm                     // Diameter of dust cap
  hD1=10mm                     // Height of dust cap
  hD2=45mm                     // Height of total cone on the outside
  dVC=30mm                     // Diameter of voice coil
  hVC=4mm                      // Height of voice coil
  dM=80mm                      // Diameter of magnet
  hM=30mm                      // Height of magnet
  hasbaffle=true
  Color=Blue 0.5;
DrvColor=Blue 0.5;- Home
- Loudspeakers
- Multi-Way
- Modular active 3 way - work in progress