I thought I had proved you could EQ any squiggle away with my simulation experiment, provided you had a high enough precision and time resolution filter. You should try, if you have time.
I also noticed you are showing windowed IRs; what is your window?
It seems that changing the FDW cycle width does affect the windowed IR. As you make window narrower, more of the squiggles go away. This does support the theory that the squiggles have to do with the later arrivals. That may not be mutually exclusive with being able to EQ the squiggles away. OTOH, in my single driver experiment there weren't any late arrivals. So I would love to see what the IR looks like for a fully tuned array.
I thought I had proved you could EQ any squiggle away with my simulation experiment, provided you had a high enough precision and time resolution filter. You should try, if you have time.
I also noticed you are showing windowed IRs; what is your window?
It seems that changing the FDW cycle width does affect the windowed IR. As you make window narrower, more of the squiggles go away. This does support the theory that the squiggles have to do with the later arrivals. That may not be mutually exclusive with being able to EQ the squiggles away. OTOH, in my single driver experiment there weren't any late arrivals. So I would love to see what the IR looks like for a fully tuned array.
No sorry, the simulation doesn't show me anything really.
It's simply impossible to remove multiple-arrival squiggles, other than to a precise spot....we are just talking classic comb filter science here, agreed??
This is the nuts of the squiggle issue imho.
The windowing I used was just REW's default windowing...nothing else, no FDW.
Notice the 0.0% windowing
I guess in theory you could eq (FIR + IIR) everything at the mic position to look like a dirac pulse so in a sense you could eq the wiggles away. Not sure what that pulse would look like over the entire couch area though.
My arrays are not perfectly tuned by any means but I'll do another set of measurements after work today. I do not eq fullband per say but use a series of shelving biquads to take care of the array. Most eq goes on below 400hz in order to hammer out the room problems I have. Speaker placement and some other things in-room are non-negotiable🙂.
I use holm impulse to measure the IR and am getting to know REW a bit better.
I agree it doesn't demonstrate anything about multiple arrival squiggles because the measurement was of a single driver but it does show that those particular squiggles could be EQed away, which was surprising to me even if it shouldn't have been.
Not to be argumentative but in the interest of getting at a full understanding...
More is involved that comb filtering. Comb filtering produces a different kind of squiggle and in the frequency domain. I'm not sure what it looks like in the time domain. Probably looks like multiple peaks....one for each of the sources that are combing. That is not what we see in your set of IRs. For me at least, translating from time to frequency domain is not intuitive.
Part of the "more is involved" is the mathematical theory of line sources which predicts a single peaked IR for an infinite line source. This is supposed to be approximated by our nearly floor to ceiling discrete line arrays; the question being how close an approximation. Apparently not very close where the spacing between drivers is more than a wavelength but close enough for a good listening experience.
I think the way to nail this down is to FIR an array as smooth and flat as it can be made at a single spot in a room, preferably a treated room, and then look at its IR. The reason being you have to exclude the possibility that the squiggles, if any, are due to frequency response irregularities. If its possible to EQ them away, then the aren't due to multiple arrivals. One has to try before drawing any conclusions.
In Mark's work, which I appreciate, I see correlation between amount of squiggling and number of drivers but not proof because the corresponding frequency responses aren't shown. If all FRs had been EQed the same, that would be if not proof, then close to it.
Well, some progress today - we've come up with a new technical term, squiggle 🙂
actually we've already seen Wesayso's IR and IIRC it doesn't have the kind of squiggling we seen in our imperfectly equalized arrays.
Technically if you eq 2 systems to have the exact same transfer function then the IR will be same ie no squiggles if "perfect" or close to. Maybe we can do that over a wide enough range for our listening positions with our LA? Not sure on the last one.
That said I personally can't tell much of a difference between a 3 way speaker that has LR4 crossovers and phase wrap vs that same speaker using FIR to correct for phase wrap and measured to have a dirac pulse IR. I just could not detect that much of a difference and those IR are very different from each other.
If IN = OUT is the gold standard then FIR and eq to a dirac pulse. So I guess yes it would be possible "eq" out the squiggles but not sure under what conditions that statement holds true.
Simulation results are interesting.
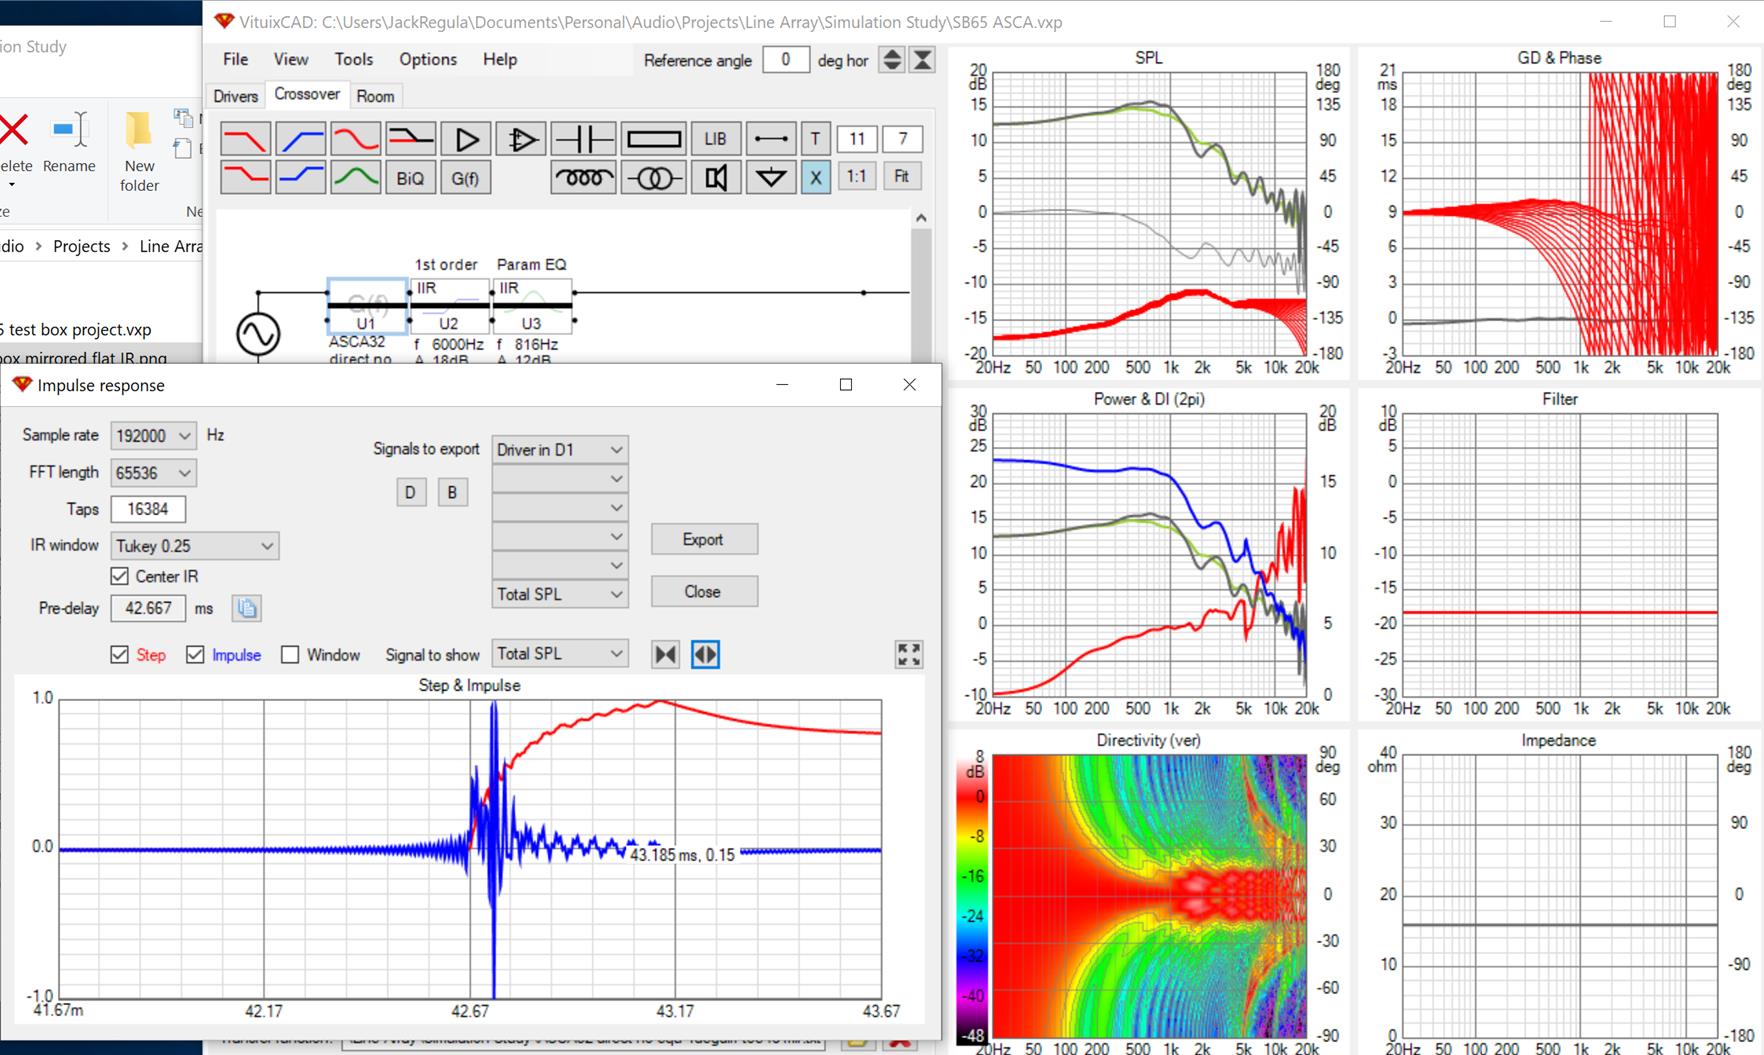
First the unequalized array and its IR on axis:
Next the "perfectly" equalized array and its IR on axis:
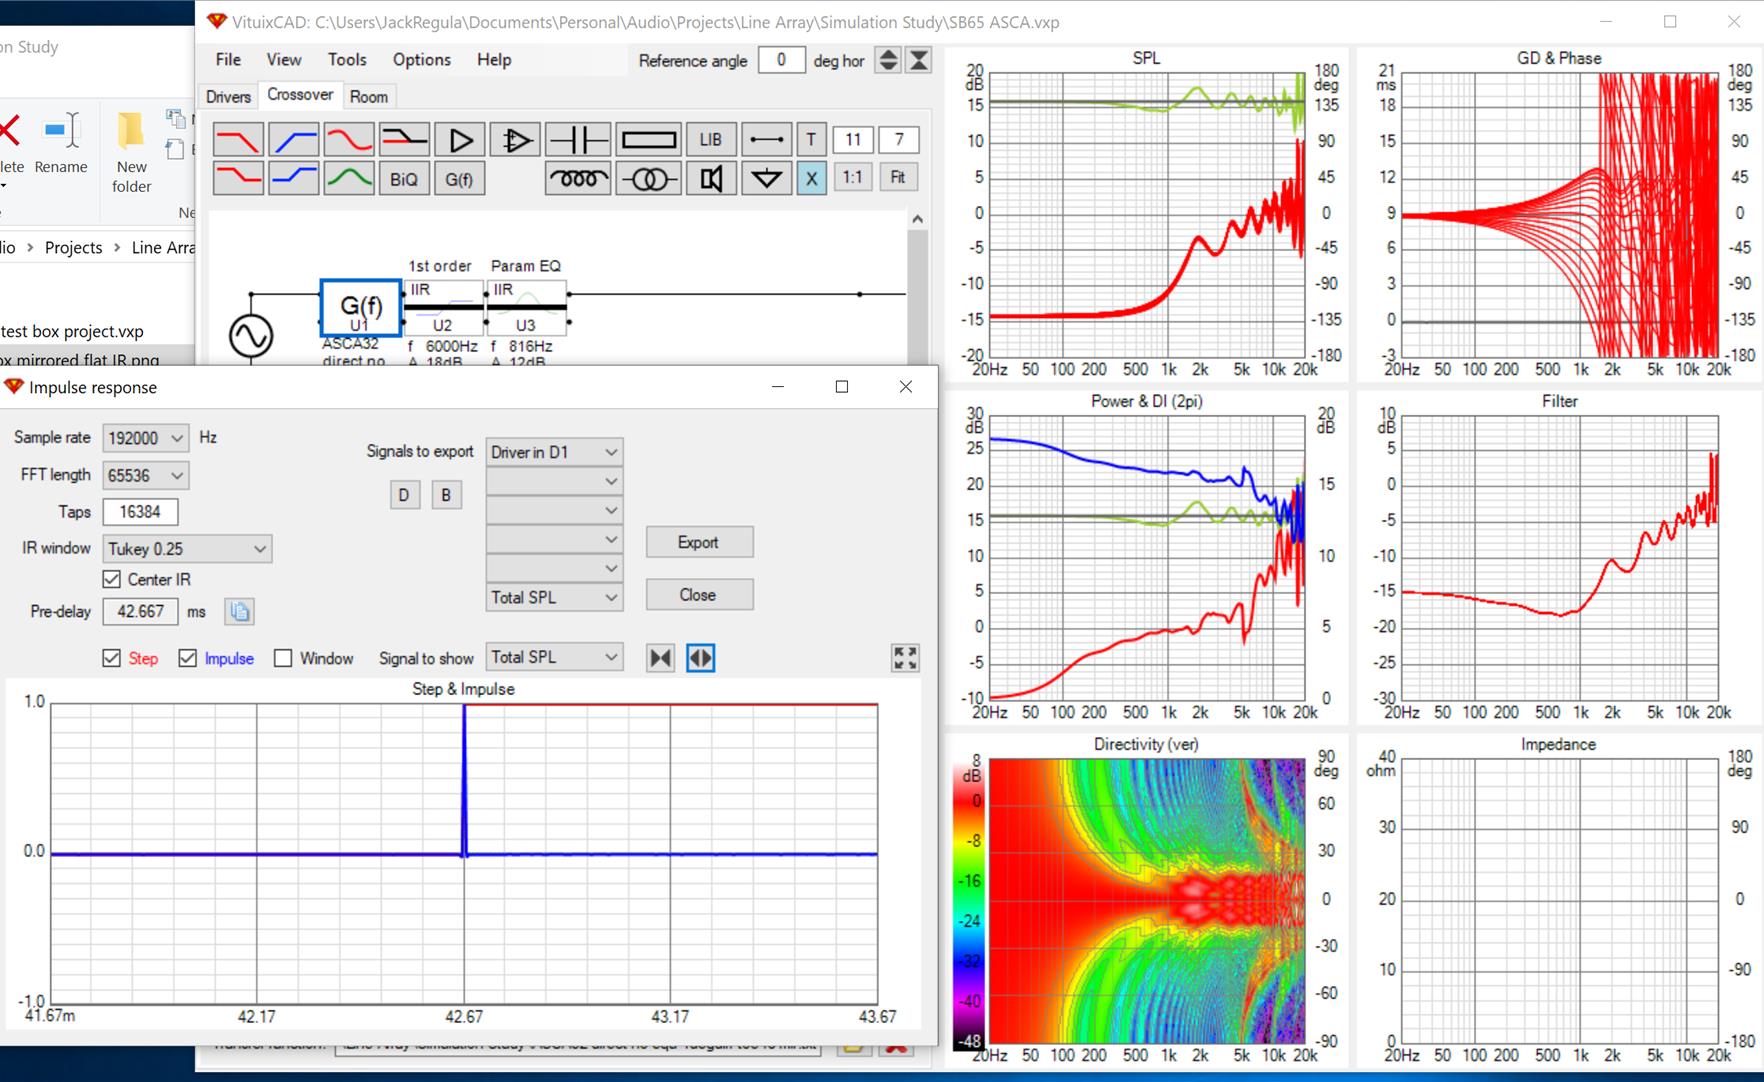
perfect at one spot
Lastly, the "perfectly" equalized array and its IR 10 degrees off axis:
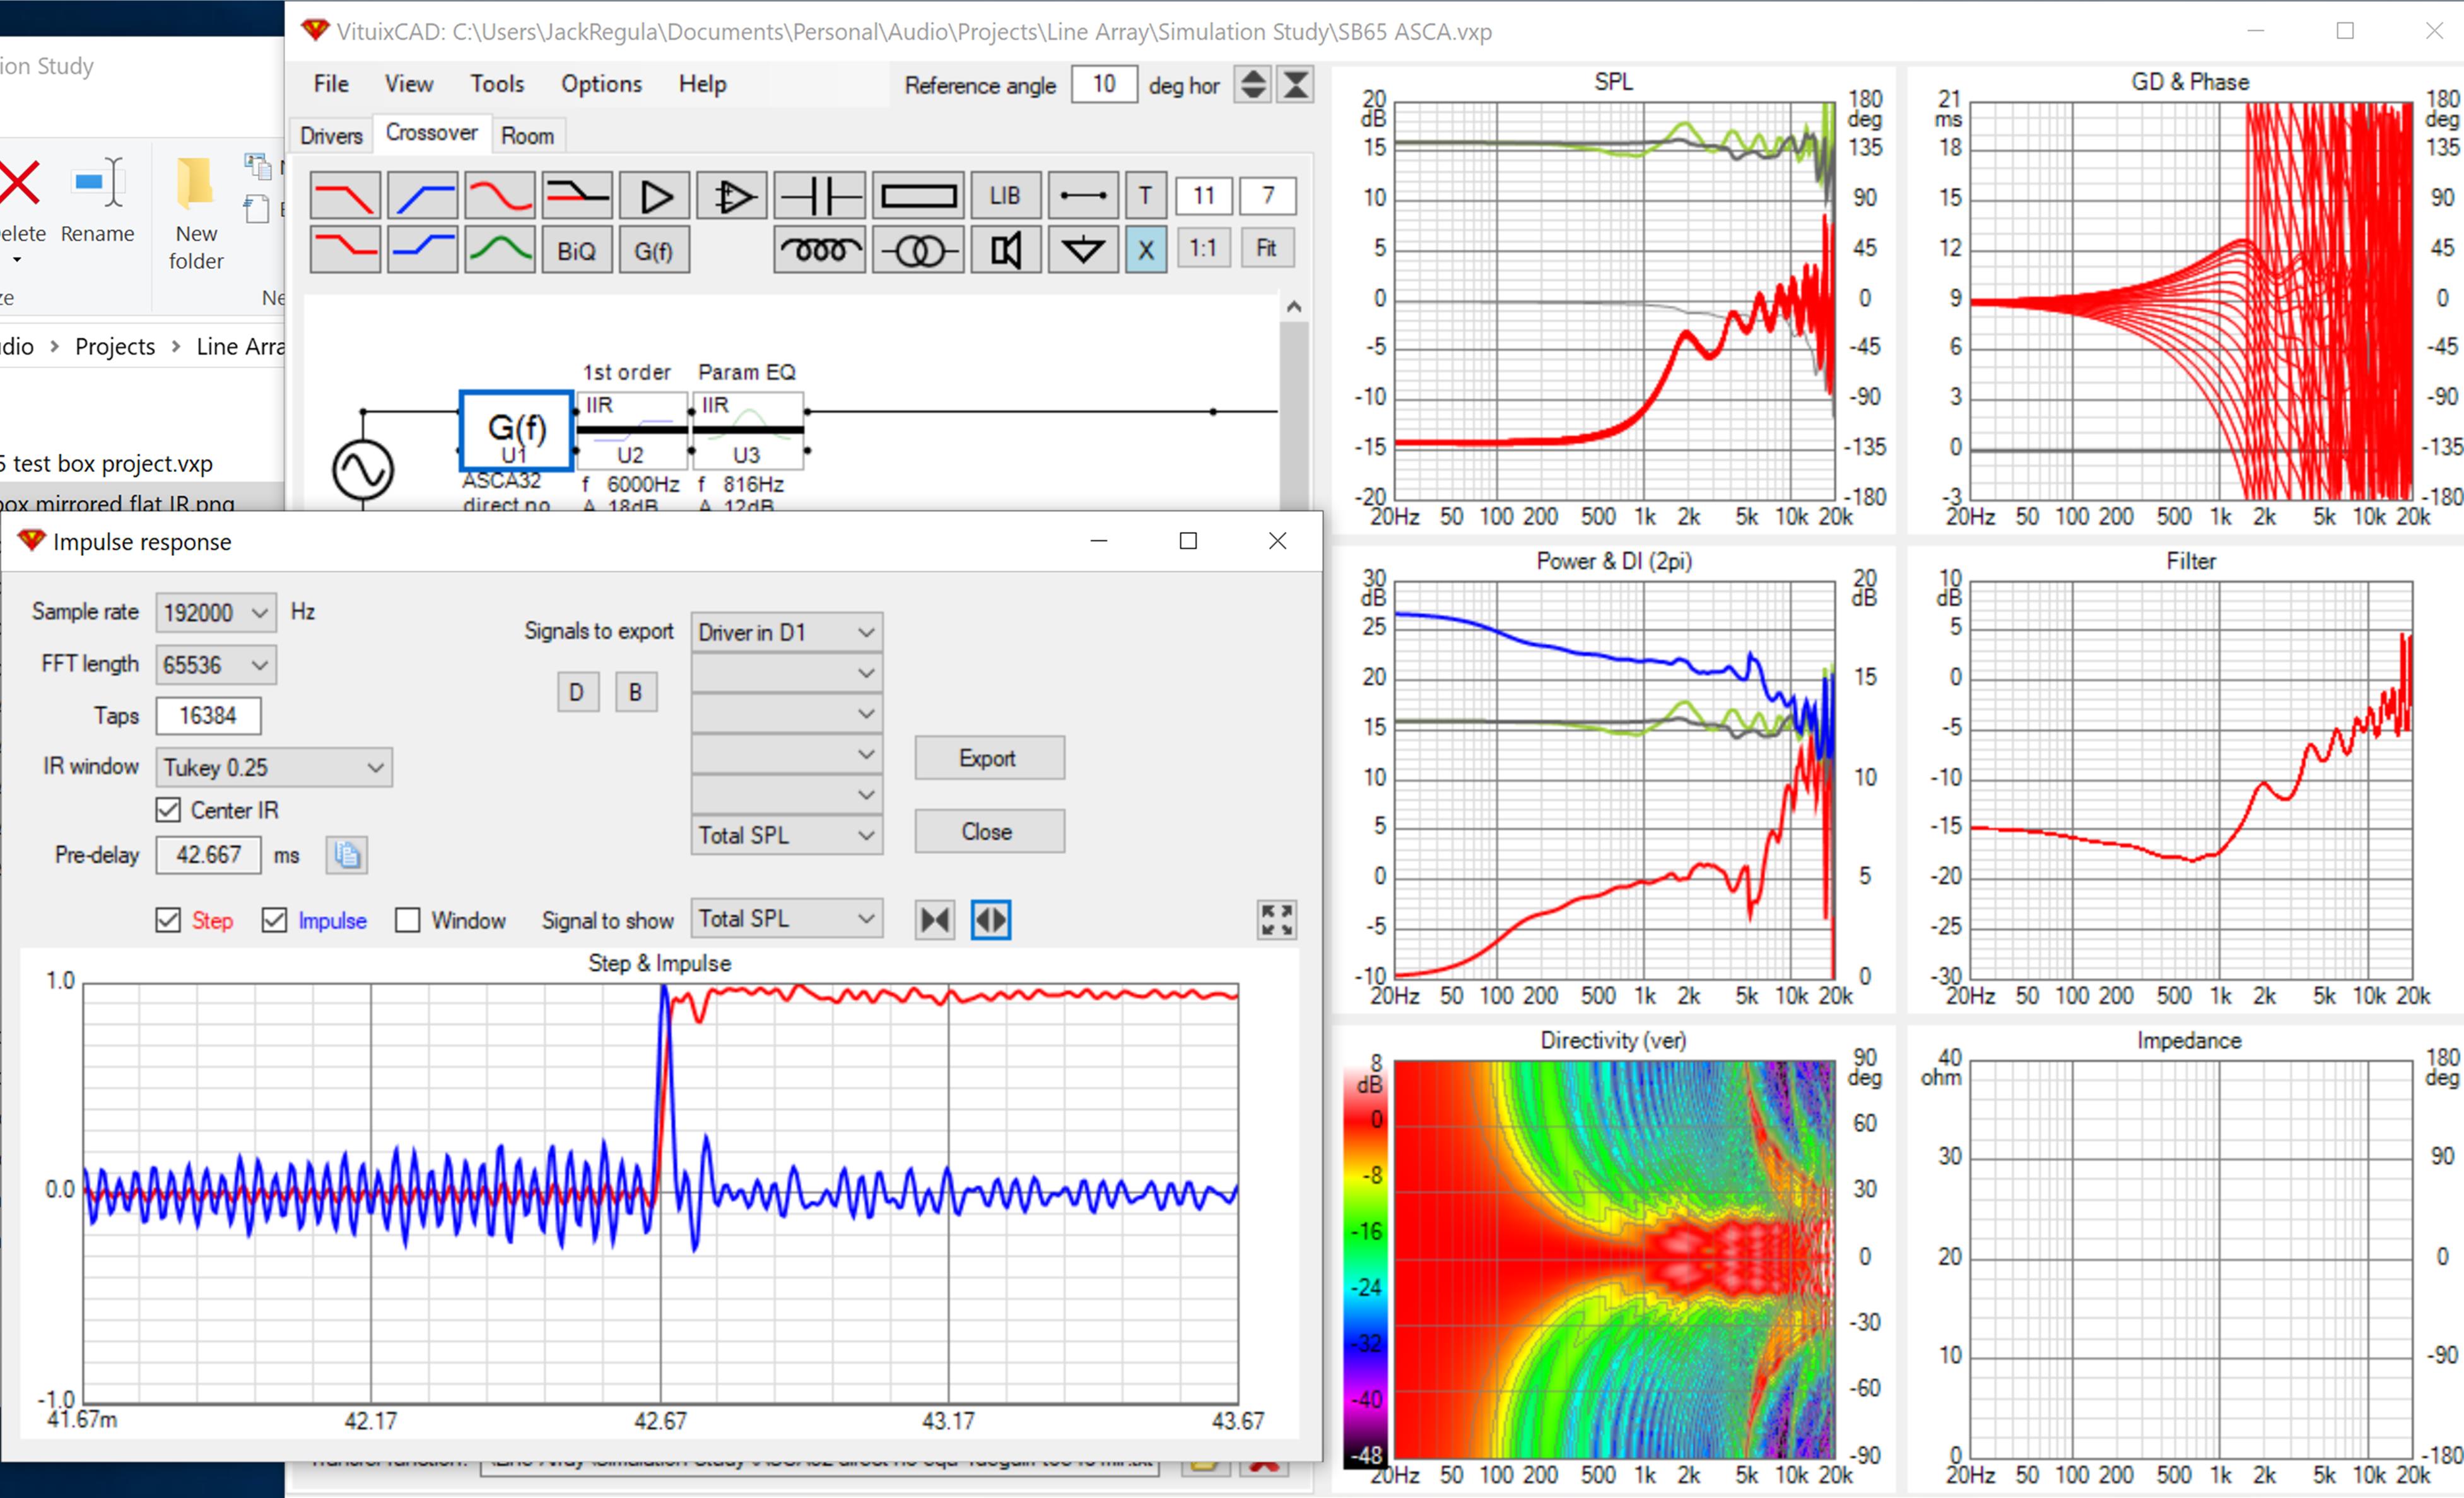
Still pretty good 10 degrees off axis....what about 20?
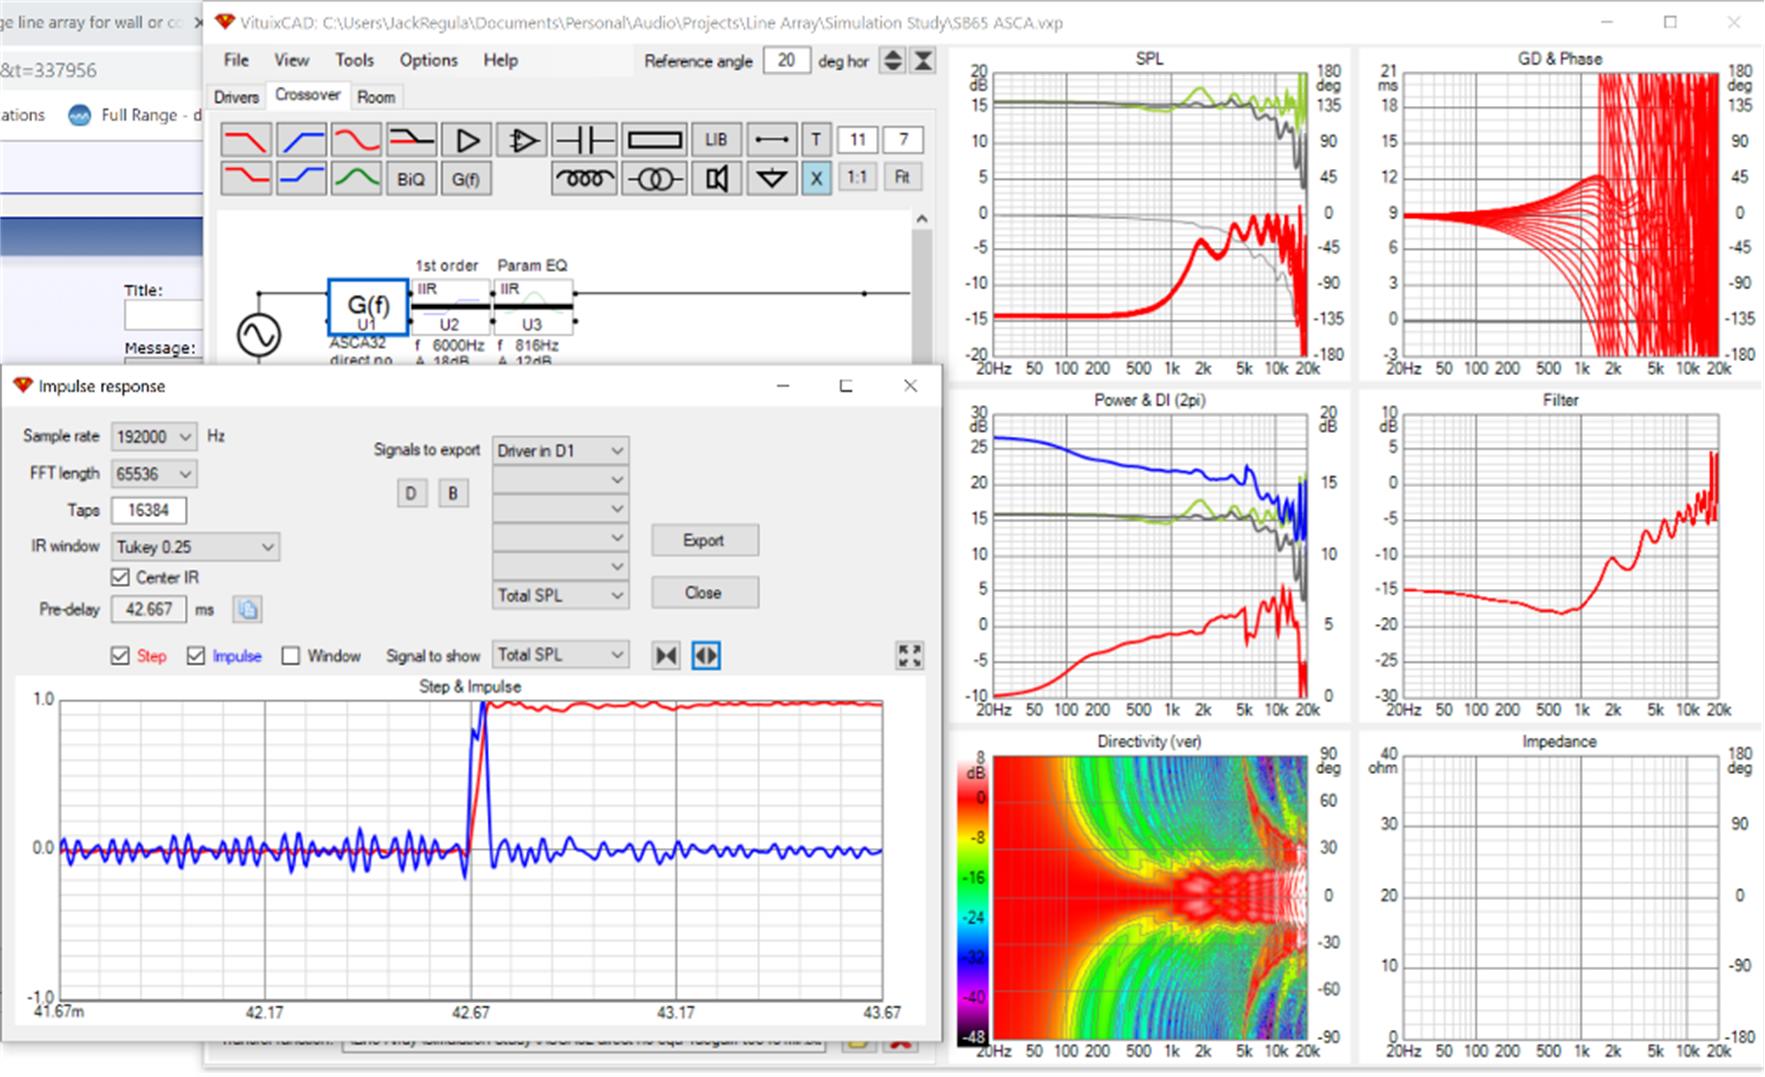
response suffers 20 degrees off axis because of beaming
First the unequalized array and its IR on axis:
Next the "perfectly" equalized array and its IR on axis:
perfect at one spot
Lastly, the "perfectly" equalized array and its IR 10 degrees off axis:
Still pretty good 10 degrees off axis....what about 20?
response suffers 20 degrees off axis because of beaming
Attachments


Mark100 is exactly right! If all we wanted was to listen to raw line arrays without any EQ applied. However, once we start eq-ing we have several choices to make. It's no different than getting a multiway in shape at a certain point by making crossover decisions.
The correction we want is one that works over a large area. And we can get just that.
This does not mean we get rid of all the wiggles and shoot for the best looking IR.
Out of curiosity, I've tried of course. It's perfectly doable, but not as much fun to listen to.
Let's not make the whole proces any more difficult than it needs to be, arrays need EQ. You can do this by hand and use IIR EQ, you can use an automated EQ process like the one included in REW. By hand you can actually do better than that automated process.
Or you could use a tool designed to edit the pré signal so it comes out looking like a Dirac pulse when you measure the speaker. I've got a whole thread full with examples of just that. Even with basic EQ, the IR won't look like the ones posted here most recently, so why hang all kinds of theories on something we're not even after? Unless you do want to listen to raw non EQ-ed arrays of course, be my guest, I know what that sounds like. 😀
My purpose in exploring the impulse squiggles has been to determine what can be fixed with EQ and what can't. So, I am emphatically not saying to listen without EQ.
Normally, I do all my tuning in the frequency/phase domain, and don't even look at impulse until there are response variations that EQ doesn't fix.
Then, I know I am looking at a non-minimum phase response anomaly, and it's time to look in the time domain to try to figure out what is going on.
I get enough frequency response variation in the array's high end for even slight movements of mic position, that I've been studying impulse.... and keep coming back to 'multiple arrivals' as the cause.
I am used to being able to move a mic in a much wider area and maintain flatter freq and phase response.
Yes, there are two ways to remove the squiggles that I know of....completely FIR them out at a precise spot.....or ignore them by smoothing them out with measurement windowing.
I'm still trying to do neither until I fully understand their cause.
I think my next learning step is to look at impulses that are bandwidth limited. I'd like to try cutting out high freq content and see if the impulse cleans up.
My thinking is that if I find the frequency cutoff where the impulse is clean below it, and starts getting squiggled above it, that that should be the frequency where the line array quits acting as a line.
I'm hoping to see how this cutoff frequency (if the experiment works) relates to the common 1/2 WL center-to-center rule of thumb.
I want to run that test out in the driveway, as reflection free as possible.
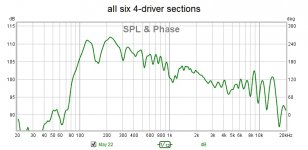
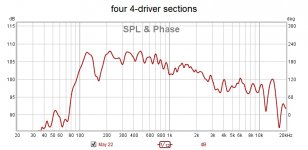
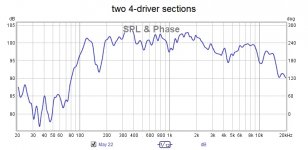
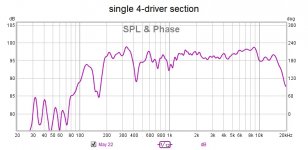
In the meantime, here are the freq response from the array impulses previously show. Pls remember these measurements are only 'halfway' reflection reduced.
1 section
2 sections
4 sections
6 sections
As you can see, freq response starts breaking up in the top end as more sections are added.
I think the high end freq breakup is what is also being seem in the impulse squiggles.
Thx for listening 🙂 Mark
Normally, I do all my tuning in the frequency/phase domain, and don't even look at impulse until there are response variations that EQ doesn't fix.
Then, I know I am looking at a non-minimum phase response anomaly, and it's time to look in the time domain to try to figure out what is going on.
I get enough frequency response variation in the array's high end for even slight movements of mic position, that I've been studying impulse.... and keep coming back to 'multiple arrivals' as the cause.
I am used to being able to move a mic in a much wider area and maintain flatter freq and phase response.
Yes, there are two ways to remove the squiggles that I know of....completely FIR them out at a precise spot.....or ignore them by smoothing them out with measurement windowing.
I'm still trying to do neither until I fully understand their cause.
I think my next learning step is to look at impulses that are bandwidth limited. I'd like to try cutting out high freq content and see if the impulse cleans up.
My thinking is that if I find the frequency cutoff where the impulse is clean below it, and starts getting squiggled above it, that that should be the frequency where the line array quits acting as a line.
I'm hoping to see how this cutoff frequency (if the experiment works) relates to the common 1/2 WL center-to-center rule of thumb.
I want to run that test out in the driveway, as reflection free as possible.
In the meantime, here are the freq response from the array impulses previously show. Pls remember these measurements are only 'halfway' reflection reduced.
1 section
2 sections
4 sections
6 sections
As you can see, freq response starts breaking up in the top end as more sections are added.
I think the high end freq breakup is what is also being seem in the impulse squiggles.
Thx for listening 🙂 Mark
Attachments
re' the FRs.
I see the same/similar thing in Vituix model of my array. More "breakup" or general unsmoothness also when floor and ceiling reflections are included (but reflections only appear in the separate room response curve) . As you add sections it starts looking more like combing. In mine this starts at 5 khz whose wavelength happens to be the spacing.
Due to the geometry and the driver's beaming, you get less and less contribution from the drivers at HF from drivers further from the center of the array. As a result, the array is frequency tapered by default. Interesting to see what results from further tapering
Just be sure to use varying distance from the array as another variable. As it will surely influence where the combing seems to start. Try to measure up close and far away and tell me if the 1/2 wavelength rule still makes any sense.
You've got to start thinking distance to microphone from each separate component in the array for it to start making sense. Which isn't different from any other multiway. Except here we have many more sources. When that sinks in you'll start to see why more than one driver still sums positively at reasonable distances and where and why the combing starts (at varying distances from the array).
Next figure out the same for a CBT. Hopefully that will help for it to start making sense.
By the way, look up the measured impulse of the focussed array, which can be found somewhere in my thread. Do you figure it matters how far apart those drivers are in that focussed array? A CBT is bent the other way, which makes a straight array fall in between these two.
With perfect point sources when in a standard Stereo triangle, the combing from those two perfectly adjusted speakers at your ear will start somewhere at ~1750-1850 Hz. Yet that is what most people strive for and listen to. No doubt there will be combing though! Ever changing if you move position. Have you heard it? No doubt you have listened to it. Have you ever wondered about it? I know I have.
Last edited:
Just be sure to use varying distance from the array as another variable. As it will surely influence where the combing seems to start. Try to measure up close and far away and tell me if the 1/2 wavelength rule still makes any sense.
You've got to start thinking distance to microphone from each separate component in the array for it to start making sense. Which isn't different from any other multiway. Except here we have many more sources.
Yep, varying distance for sure.
Hopefully I'm past the 'start thinking distance to microphone' part 😉
I've made numerous presets that vary the delay times to the six sections based on distance to mic for whatever focus I'm trying. Also using amplitude shading.
It's easy to move the sound up and down the array, aim in it higher/lower, mimic a CBT, or concave focus.
If only I could get the spreadsheet to automatically load the delays and shadings lol
I think what intrigues me the most, and is last on the list to try...is the frequency shading that's been discussed on the line steering thread.
If I can find the "line cutoff freq" I was just talking about prior post..I will use as many drivers in the center that can hang together full range, probably 2 maybe 3 sections sections like in previous analysis, and then frequency shade the remaining sections.
Yep, varying distance for sure.
Hopefully I'm past the 'start thinking distance to microphone' part 😉
I've made numerous presets that vary the delay times to the six sections based on distance to mic for whatever focus I'm trying. Also using amplitude shading.
It's easy to move the sound up and down the array, aim in it higher/lower, mimic a CBT, or concave focus.
If only I could get the spreadsheet to automatically load the delays and shadings lol
I think what intrigues me the most, and is last on the list to try...is the frequency shading that's been discussed on the line steering thread.
If I can find the "line cutoff freq" I was just talking about prior post..I will use as many drivers in the center that can hang together full range, probably two maybe 3 sections sections like in previous analysis, and then frequency shade the remaining sections sections.
Ever wondered about what makes the CBT work? It has a fixed bent shape, yet you can listen to it at varying distances. The distance from each driver to microphone in a CBT is varying more than in a straight array, so why does it work? What is it trying to mimic? 🙂
If you want a shaded array, frequency dependent shading, you'd still need to pick an arbitrary distance from where you want to view it. As it will change with distance. Unless you pick it close to the array and view it as an endless WMTMW (to mimic a point source and not a line).
For my specific goals, an infinite line source means: no shading. A finite line source means: shading.
Last edited:
Remember that for line arrays you won't get combing predicted by simple path length difference calculations. That is because one driver placed closely to another alters the local pressure gradient and alters wavefront shape from what an isolated driver produces. Close enough, and you get a cylindrical wavefront launch (for straight array) with single peak in IR. That's what all the 1/4, 1/2, 1 wavelength rules of thumb are trying to achieve.
But it isn't an all or nothing. Even if cylindrical wavefront isn't achieved at the speaker surface, there is still alteration of pressure gradients which expands as the field propagates and at some distance simply merges with an adjacent wavefront instead of interfering with it. That takes a lot of distance in conventional designs... not so much in line arrays with close spacing.
But it isn't an all or nothing. Even if cylindrical wavefront isn't achieved at the speaker surface, there is still alteration of pressure gradients which expands as the field propagates and at some distance simply merges with an adjacent wavefront instead of interfering with it. That takes a lot of distance in conventional designs... not so much in line arrays with close spacing.
Hi wesayso, My understanding of the CBT is minimal still.
But I thought it was mainly about using a line in a way to neutralizing floor and maybe ceiling reflections.
As far as general line theory in the context of current discussion, I've noticed the PE CBT kits have moved to smaller HF/VHF drivers.
@ RHosch, yes thanks. I'm expecting to see a transition, or rather hoping to measure one, from what appears to full line coupling to fully independent drivers
Right you really can't talk about combing without specifying the distance. Here is a spreadsheet that breaks out the delta path length per driver for several distances to the array.
Thank you Jack, that's much nicer than the spreadsheet I made.
Hi wesayso, My understanding of the CBT is minimal still.
But I thought it was mainly about using a line in a way to neutralizing floor and maybe ceiling reflections.
There is a fairly simple way to conceptualize what a CBT attempts to accomplish.
Take the straight line array for example. If your goal is a uniform far field response that does not vary with height from the floor, ie a cylindrical wavefront, and you regress that back to the speaker face, the pressure gradient at speaker face dictates an infinite line of infinitely closed drivers. A standard line array.
If on the other hand your goal is a wave front that decreases in intensity with height from centerline, and you trace that wavefront back to a spherical speaker face, you find that the pressure gradient is Legendre function. If you trace the wave front to a straight speaker face, you will find Legendre shading with varying time delays.
In short, the desired far-field response dictates required near-field response which is identical to pressure gradient over a surface matching that local near-field geometry.
Last edited:
Remember that for line arrays you won't get combing predicted by simple path length difference calculations. That is because one driver placed closely to another alters the local pressure gradient and alters wavefront shape from what an isolated driver produces. Close enough, and you get a cylindrical wavefront launch (for straight array) with single peak in IR. That's what all the 1/4, 1/2, 1 wavelength rules of thumb are trying to achieve.
But it isn't an all or nothing. Even if cylindrical wavefront isn't achieved at the speaker surface, there is still alteration of pressure gradients which expands as the field propagates and at some distance simply merges with an adjacent wavefront instead of interfering with it. That takes a lot of distance in conventional designs... not so much in line arrays with close spacing.
While I 'bought into' this theory when I was looking at the available line source research and theory, I can no longer see it like that. The (imperfect) separate sources at separate distances from us (or our microphone) does explain what I measure, what I hear and how it reacts to the environment perfectly (well, as far as the imperfect sources allow).
So you can't convince me with this old theory, sorry. Tab two fingers simultaneously in a bath full of 'still' water and see what happens. That's how I still view what I'm getting from my measurements. The imperfections, the beaming and specific ways the drivers play the tones simply fill in the blanks.
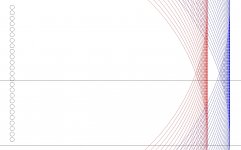
Two additional pictures might explain what I'm getting at...
Seen it done once in a JBL graph to show/explain a horn speaker and it's design axis.
An array of 25 drivers, driver to driver distance is 85 mm. The bottom horizontal line is the floor, the one above that is about 1 meter up from the floor representing an ear or a microphone.

The red circles have a radius of 3 meter, equaling a listening distance of 3 meter. The blue circles are 34.34 mm larger, half wave space of a 5 KHz tone.
Now how many blue lines are in front of the red? That's how many drivers don't yet subtract from the total output. The blue lines that don't make it out before the clear red front, will either subtract or still sum but be a cycle (or more) behind. More circles each at half a wavelength at the listening height would show us exactly what they'd do for our situation.
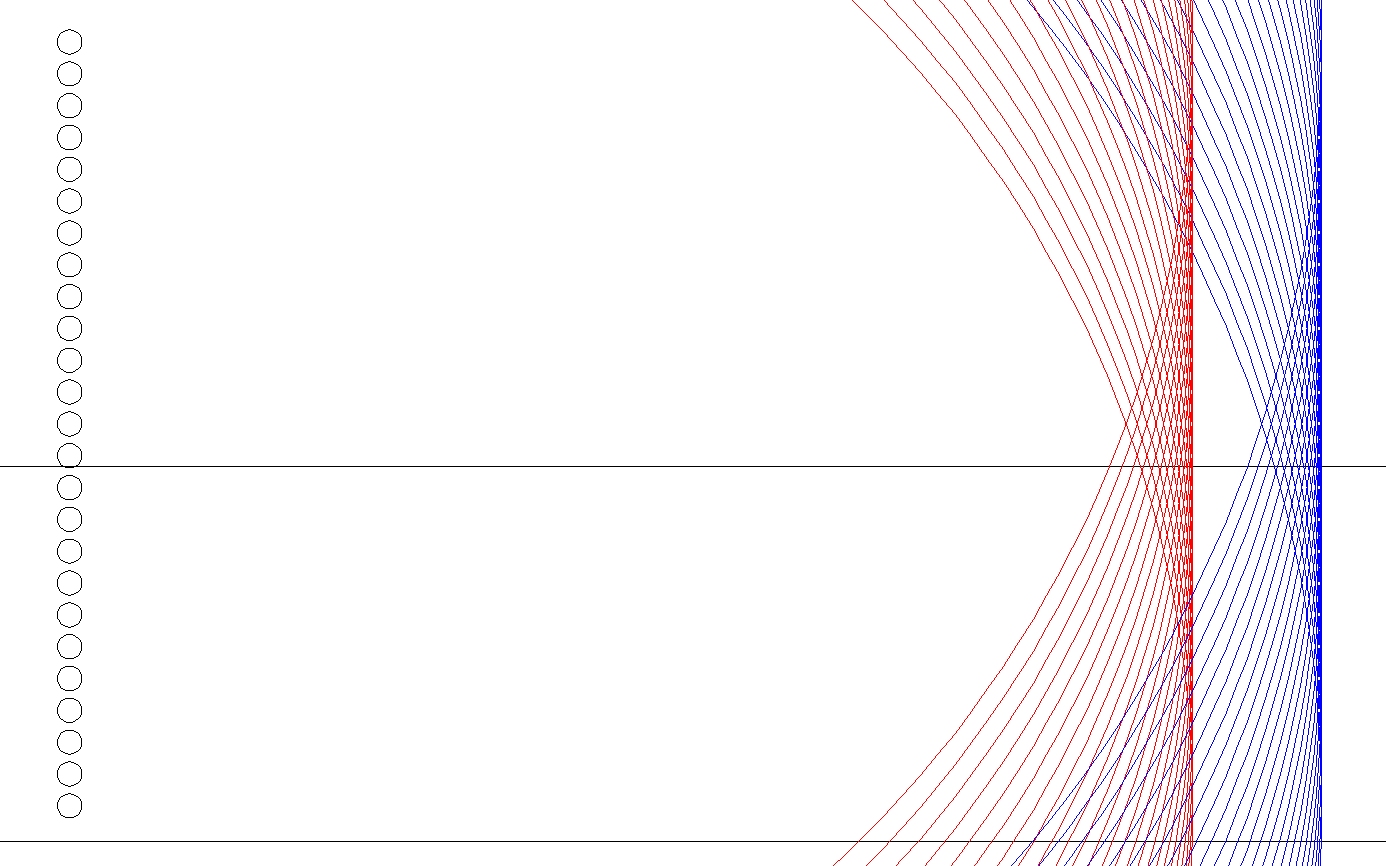
Let's look at it a little closer:
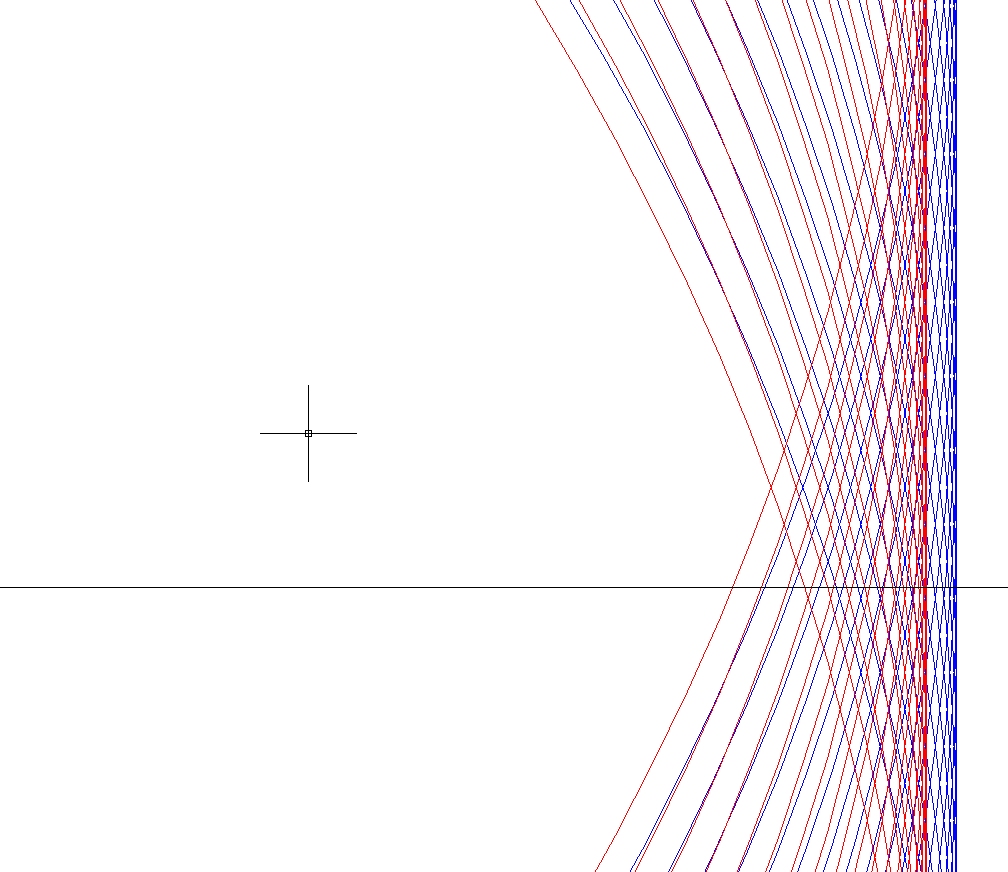
How many blue lines are in front of that red front? That's how many drivers still sum. The ones that fall behind create the combing pattern as perceived/measured.
Changing the (listening) distance will change the number of drivers that sum.
Changing the inter driver distance will also change the number of drivers that sum favorably, but it can't prevent others that will either sum or subtract, no matter how close you space them. Their output at an angle or beaming behavior does alter the results somewhat.
Repeating this for a lower frequency will start to show why one would/could assume a circular wave front looks like. Feel free to make the graphs of that, and see where all drivers still sum. Or in other words, form a 'cylindrical' wave front.
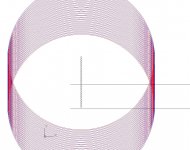
I did one more at 500 Hz, see how there aren't any drivers yet that subtract from our wave front?
For ease of reading I've left out any floor/ceiling reflection 😱.
Seen it done once in a JBL graph to show/explain a horn speaker and it's design axis.
An array of 25 drivers, driver to driver distance is 85 mm. The bottom horizontal line is the floor, the one above that is about 1 meter up from the floor representing an ear or a microphone.
The red circles have a radius of 3 meter, equaling a listening distance of 3 meter. The blue circles are 34.34 mm larger, half wave space of a 5 KHz tone.
Now how many blue lines are in front of the red? That's how many drivers don't yet subtract from the total output. The blue lines that don't make it out before the clear red front, will either subtract or still sum but be a cycle (or more) behind. More circles each at half a wavelength at the listening height would show us exactly what they'd do for our situation.
Let's look at it a little closer:
How many blue lines are in front of that red front? That's how many drivers still sum. The ones that fall behind create the combing pattern as perceived/measured.
Changing the (listening) distance will change the number of drivers that sum.
Changing the inter driver distance will also change the number of drivers that sum favorably, but it can't prevent others that will either sum or subtract, no matter how close you space them. Their output at an angle or beaming behavior does alter the results somewhat.
Repeating this for a lower frequency will start to show why one would/could assume a circular wave front looks like. Feel free to make the graphs of that, and see where all drivers still sum. Or in other words, form a 'cylindrical' wave front.
I did one more at 500 Hz, see how there aren't any drivers yet that subtract from our wave front?
For ease of reading I've left out any floor/ceiling reflection 😱.
Attachments
- Home
- Loudspeakers
- Full Range
- Full range line array for wall or corner placement