I would try changing the PSInterpolationType value to L or R, S as used in that script will not have the output track the target very well as it is using a bilogarithmic scale.
Sometimes that can useful to generate curves that are hard to specify as a target but I prefer to get what I asked for")
Sometimes that can useful to generate curves that are hard to specify as a target but I prefer to get what I asked for
I would try changing the PSInterpolationType value to L or R, S as used in that script will not have the output track the target very well as it is using a bilogarithmic scale.
Sometimes that can useful to generate curves that are hard to specify as a target but I prefer to get what I asked for
Hi here... weather is soo good in DK, we had barbecue yesterday and some oldies and youngers did take a quick listning. (keeping distance)
They obviously could hear my BassEQ was down; they listended a lot before when we they was here!
Just a short update from here, and everything is working very good now.
Thanks wesayso & fluid again for helping me.
Will be back soon with some real listning test's.
Jesper,
I think someone on this thread suggested keeping the target flat and using post convolution filtering to provide the "house curve". That is what I do and it makes it very easy to play with the sound profile by simply bumping the level at 20Hz and/or 20kHz up or down real-time (I'm using Equalizer-APO). I am way more sensitive to the tonal balance than the convolutional artifacts and am constantly changing it. On my system I seem to prefer flat to down maybe 3dB at 20k, but then I'm only about 5ft from my speakers. My sub with current filtering is flat to 20Hz and I often have to tone that down a bit.
I have played a little more with different convolutional filters and am pretty happy with the Normal filters, no mods. Also equalized my surround speakers and was amazed at how good they now sound playing music from only them and the sub. Probably not that big an impact on overall listening quality since the surrounds are just adding a bit of ambiance, but why not do it.
I have played a little more with different convolutional filters and am pretty happy with the Normal filters, no mods. Also equalized my surround speakers and was amazed at how good they now sound playing music from only them and the sub. Probably not that big an impact on overall listening quality since the surrounds are just adding a bit of ambiance, but why not do it.
Hey fellow dsp's
I'am getting really really good results with this, so glad that i learned this (the hard way?)
When i left the forum 3 weeks ago i tested my main stereo with some of the gmad scripts with fluids "housecurves"... etc... in 44100. Things are getting better and better and this stuff really makes a difference aka' everyone can hear the difference!
But i realized that i needed a testsetup so to not take control of the livingroom from time to time (A LOT of time actually).
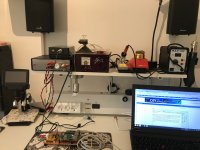
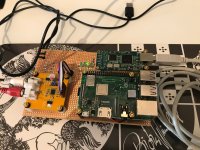
So up to my shop and order a new Amanero USB to i2s so that i can make a simmulair setup there without having to change parameters every time i try; but i also needed an testamp. and a cheap DAC which can take samples upto at least 32/192 to make this serious. I ended up with an LM4780 poweramp, which i had a pcb for, some boxes and a potentiometer to get it all going. (See the two pictures)
I was really challenged because there was a fault on my new Amanero board, but thoose guy's in Italy are really great, telling me that i will still remain warrenty even if i tried to repair the board myself. So lucky me it was a bad solder underneth one of the oscillators.
Reflowed and fixed, everything is working
So i started to dig deep into the sample rate conversion and figured out howto do it the right way.
I measure everything in both 44100 and 48000 now, because SRconversion is better off with "paired" samplerates aka'
Family 1 is 44100, 88200, 176400
Family 2 is 48000, 96000, 192000
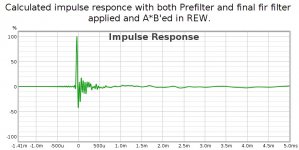
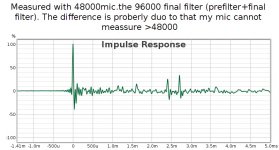
I will not clutter this thread with all my notes now, but just tell that i am capable of doing it now as i wanted from the start. I have created some tests comparing the simulated impulses vs. the measured impulses and they look right to me.
I created the filters i use now except for the 44100's in DRC Designer, next thing i will try to make work is to rewrite the Gmad's script to accept other than 44100
Just a quick follow up guy's... Thanks 1000X again for helping me all the way to here.
Jesper.
I'am getting really really good results with this, so glad that i learned this (the hard way?
)When i left the forum 3 weeks ago i tested my main stereo with some of the gmad scripts with fluids "housecurves"... etc... in 44100. Things are getting better and better and this stuff really makes a difference aka' everyone can hear the difference!
But i realized that i needed a testsetup so to not take control of the livingroom from time to time (A LOT of time actually).
So up to my shop and order a new Amanero USB to i2s so that i can make a simmulair setup there without having to change parameters every time i try; but i also needed an testamp. and a cheap DAC which can take samples upto at least 32/192 to make this serious. I ended up with an LM4780 poweramp, which i had a pcb for, some boxes and a potentiometer to get it all going. (See the two pictures)
I was really challenged because there was a fault on my new Amanero board, but thoose guy's in Italy are really great, telling me that i will still remain warrenty even if i tried to repair the board myself. So lucky me it was a bad solder underneth one of the oscillators.
Reflowed and fixed, everything is working
So i started to dig deep into the sample rate conversion and figured out howto do it the right way.
I measure everything in both 44100 and 48000 now, because SRconversion is better off with "paired" samplerates aka'
Family 1 is 44100, 88200, 176400
Family 2 is 48000, 96000, 192000
I will not clutter this thread with all my notes now, but just tell that i am capable of doing it now as i wanted from the start. I have created some tests comparing the simulated impulses vs. the measured impulses and they look right to me.
I created the filters i use now except for the 44100's in DRC Designer, next thing i will try to make work is to rewrite the Gmad's script to accept other than 44100
Just a quick follow up guy's... Thanks 1000X again for helping me all the way to here.
Jesper.
Attachments
That can be a bit of work as apart from using a measurement at that rate and setting the file to use that rate all the windows and filter lengths will need to be adjusted to accommodate the sample rate change otherwise you will get a different correction EQ due to the windows lengths and filter resolution changing.next thing i will try to make work is to rewrite the Gmad's script to accept other than 44100
It might be worth trying to samplerate convert the 44100 DRC filter first and see how that goes as that will be much easier.
I use the easy way and have Jriver convert the audio to fit the filter as I don't have much material other than 44.1K.
That can be a bit of work as apart from using a measurement at that rate and setting the file to use that rate all the windows and filter lengths will need to be adjusted to accommodate the sample rate change otherwise you will get a different correction EQ due to the windows lengths and filter resolution changing.
It might be worth trying to samplerate convert the 44100 DRC filter first and see how that goes as that will be much easier.
I use the easy way and have Jriver convert the audio to fit the filter as I don't have much material other than 44.1K.
Yes, i have seen all the parameters, so as you said it's proberly a no go.
Converting the 44100 fir's might be an option, i will try it and look at the result.
Anyway as for now when i create my >44100 fir's in DRC-Designer i still have to convert the final .wav's into .pcm(.bin) but i wrote alan Jordan; the coder of DRC-Designer about this and he is coding a version for me witch will not delete the .pcm
... Nice guy btw...Jesper.
I'm sure one could figure out the parameters for 48000. Just look at the samples from drc itself and compare the 44100 and 48000 templates and go from there. The math needed isn't that hard. It is all about window sizes compared to sample rate and way more easy than it seems on first glance.
The main difference will be between the 44100 and 48000 families as everything else with just be increased by two or 4 times.
The calculation is not hard just work out the percentage difference 48000 / 44100 = 108.843537414966 % keep that in your calculators memory and multiply the window values by that to get them for 48000
You will probably have to round up or down some values as they won't work out exactly and they will need to be in whole samples.
Doing it for every window and filter value in the template for however many different rates you might want to use will be somewhat tedious, then again if you have more than one filter in common use...
Not difficult just boring
Maybe Henrik's standalone sample rate converter will work directly on the bin files that would make it easy to test
OCTAVE Plotting Scripts
Anyone still actively using DRC/DRC-Designer ???
Has anyone used the OCTAVE plotting scripts to view their measurements and filters ?
If you haven't used it, it creates 50 different 2D and 3D plots comparing the Uncorrected and Corrected plots (2 plots per page) and then creates an additional 50 plots comparing the DIRAC Delta and Corrected plots (2 plots per page). 100 plots per channel.
It also appears to only work for 44.1kHz.
I am trying to rework the scripts to produce 50 plots comparing the DIRAC Delta, Uncorrected and Corrected (3 plots per page) to cut the number of plots in half and speed up the plot generation.
Also attempting to make them work for other sample rates as well as plot filters from other sources or before/after measurements.
I think I have the triplets working so onto the additional sample rate support.


The Dirac Delta baseline plots are a good learning tool for newbies as well as cool way to blueprint the system.
Anyone still actively using DRC/DRC-Designer ???
Has anyone used the OCTAVE plotting scripts to view their measurements and filters ?
If you haven't used it, it creates 50 different 2D and 3D plots comparing the Uncorrected and Corrected plots (2 plots per page) and then creates an additional 50 plots comparing the DIRAC Delta and Corrected plots (2 plots per page). 100 plots per channel.
It also appears to only work for 44.1kHz.
I am trying to rework the scripts to produce 50 plots comparing the DIRAC Delta, Uncorrected and Corrected (3 plots per page) to cut the number of plots in half and speed up the plot generation.
Also attempting to make them work for other sample rates as well as plot filters from other sources or before/after measurements.
I think I have the triplets working so onto the additional sample rate support.
The Dirac Delta baseline plots are a good learning tool for newbies as well as cool way to blueprint the system.
Last edited:
The bottom plot is an interesting way to view the difference between corrected and uncorrected in time.
In a DRC script a test convolution can be created which shows the estimated corrected response and by using gmad's script that can be converted to a wav file as part of the process so it can be opened in REW and then use all of it's analysis capabilities to view the response.
As you are using linux/unix this may not appeal to you as much but it works well for me.
I do like that last plot though, if we can view it from the other side as well and if it has enough resolution it could also show us pré ringing. I've always wanted a waterfall like plot that makes it possible to see both sides. The pré part and decay. It would have been useful when I was experimenting on crosstalk compensation.
... As you are using linux/unix this may not appeal to you as much but it works well for me.
Actually, I am using both Win7 and Linux. My REW Linux install can't do wave plots due to an unimplemented function in the Java rendering routines in Linux. This also applies to the wave plots in REW's EQ screen so I have to do those in Windows. I am also waiting on a Linux friendly XMOS flash for my DAC8 before I can use it in Linux.
I do like that last plot though, if we can view it from the other side as well and if it has enough resolution it could also show us pré ringing. ...
Sincere there are 50 different plots in a set per channel, there are plenty of data views.
If you scroll down to the appendix section, it shows examples all of the plots generated.
DRC: Digital Room Correction

I got another idea today that I am working on. I am shrinking the margins so I can write another script to combine pairs of Left/Right triplets so one can compare both channels simultaneously. Should give some hints about room symmetry.
Last edited:
I discovered the Linux CLI "convert" command (not to be confused with the Windoze "convert" command) which allows images to be batch concatenated.
I just need to trim the margins in the source so the left and right channel triplet images concatenate closer together.
The images are 2332x872 so should have some good resolution if you click on them.


I just need to trim the margins in the source so the left and right channel triplet images concatenate closer together.
The images are 2332x872 so should have some good resolution if you click on them.
Last edited:
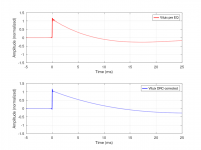
Out of curiosity I ran the script comparing the sim data I used in Vituixcad to get a comparison between my pré-EQ stage and after running DRC-FIR.

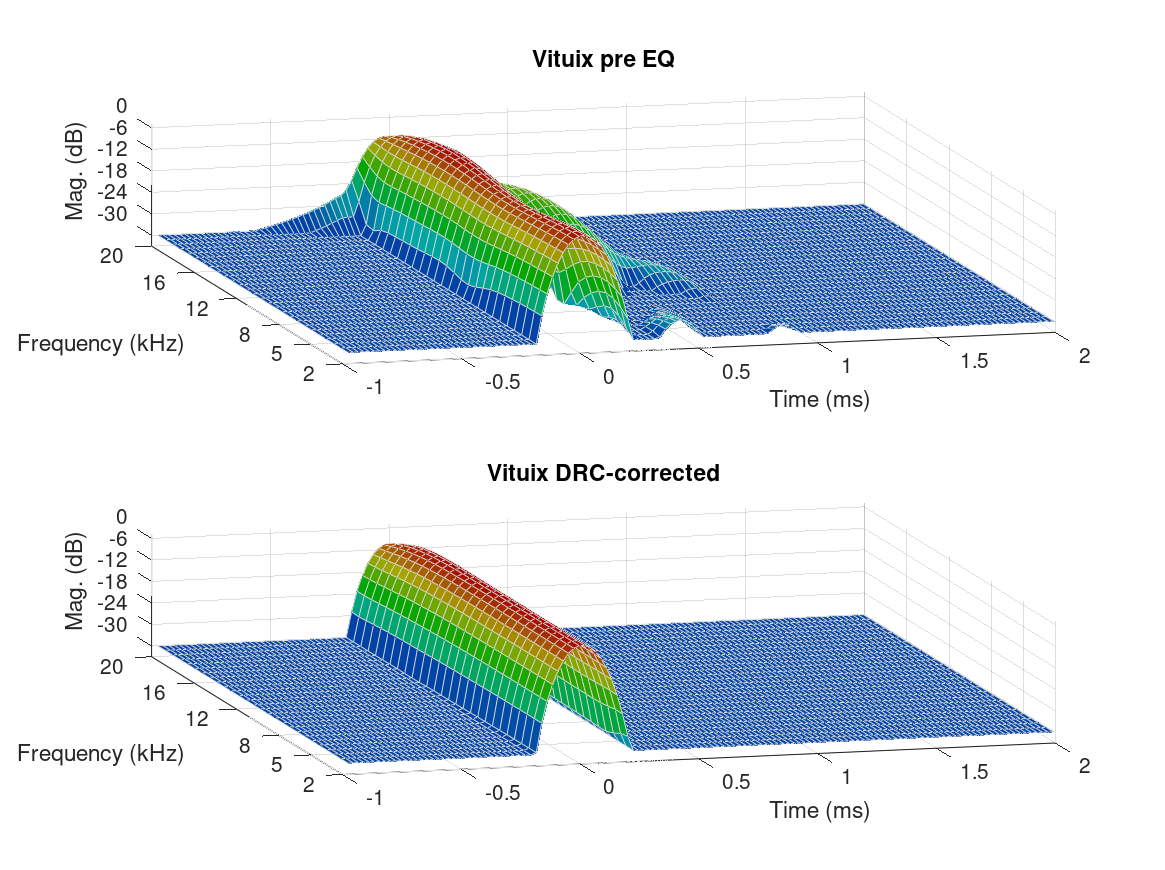
For this to work I did have to jump trough various edits, probably because of short files used etc, as they are not representing measured data but are limited length files I used to sim my arrays.
But my newly created template for these sims seems to work quite well.
Thanks for the inspiration @emailtim
(this is a pure minimum phase correction, on a simmed line array, which is why it looks this clean)
Attachments


Last edited:
I'm only correcting half of it (s instead of S within DRC), it most probably was present in the input (at a very high frequency). Although I wouldn't know why its there.
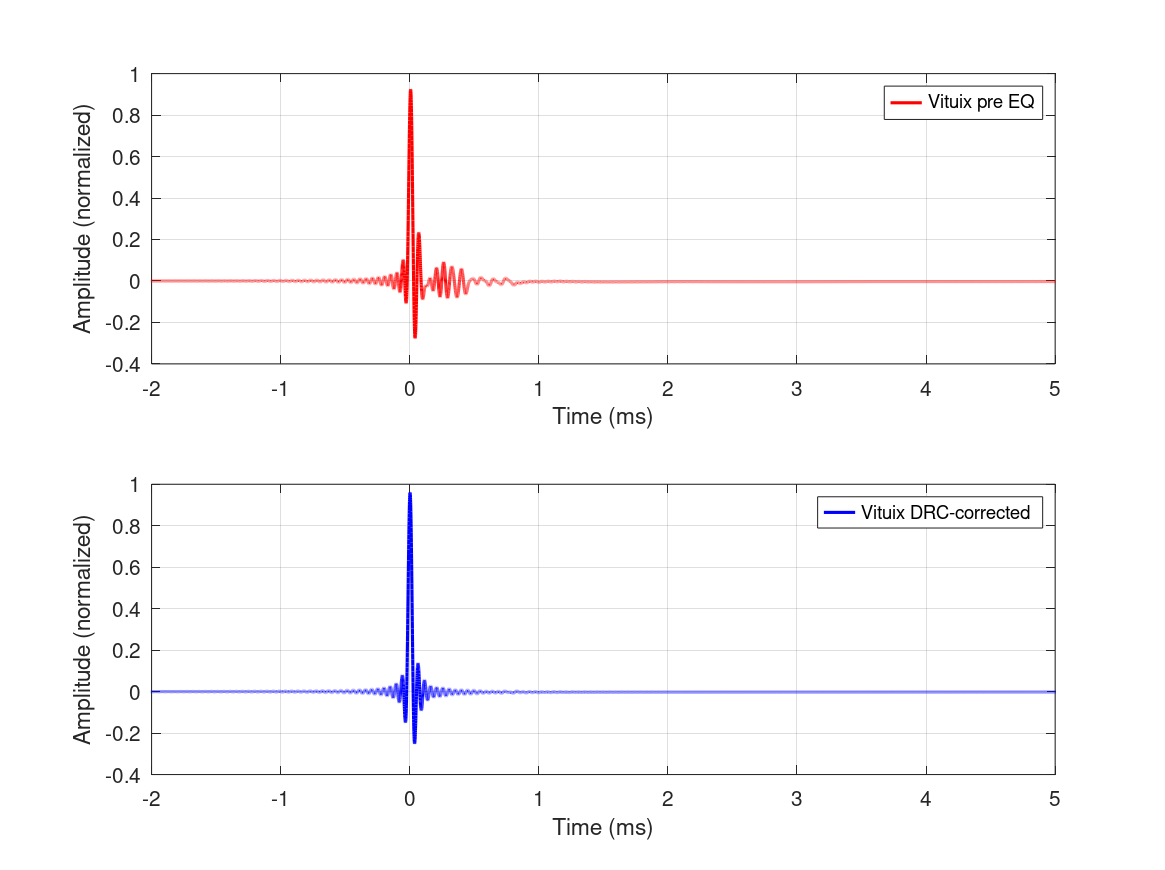
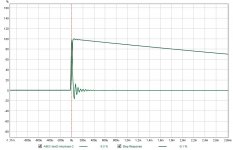
Or... the procedure of generating these graphs isn't minimum phase, as the same IR in Vituixcad looks like this:
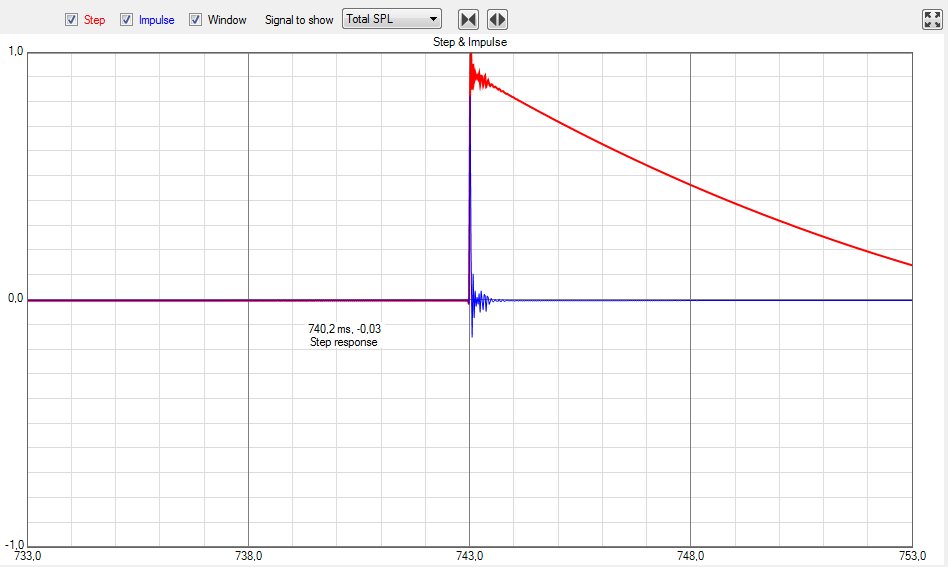
and in REW it looks like this:
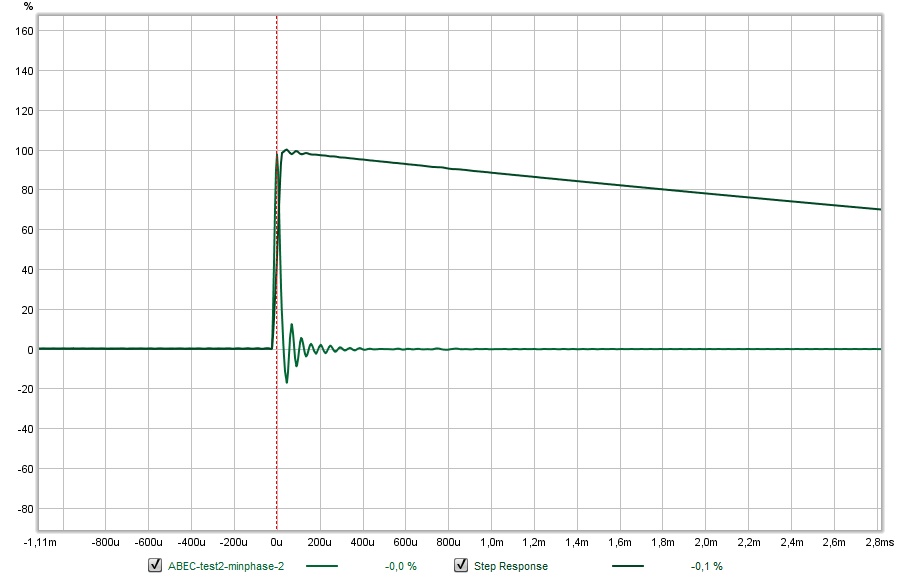
Each program renders it in its own way. But there's a lot of manipulating before plotting graphs, so I bet that's the reason.
Plus the waterfall only shows results down to -30 dB.
REW shows me, with some IR filtering, there's still some energy before the peak at < -65 dB, except for a
really narrow peak (artifact) at 22kHz which is -20 dB down
Using either a lowercase b or s for the MPPrefilterType parameters enable the single side version of the prefiltering procedures
Or... the procedure of generating these graphs isn't minimum phase, as the same IR in Vituixcad looks like this:
and in REW it looks like this:
Each program renders it in its own way. But there's a lot of manipulating before plotting graphs, so I bet that's the reason.
Plus the waterfall only shows results down to -30 dB.
REW shows me, with some IR filtering, there's still some energy before the peak at < -65 dB, except for a
really narrow peak (artifact) at 22kHz which is -20 dB down
Attachments

Last edited:
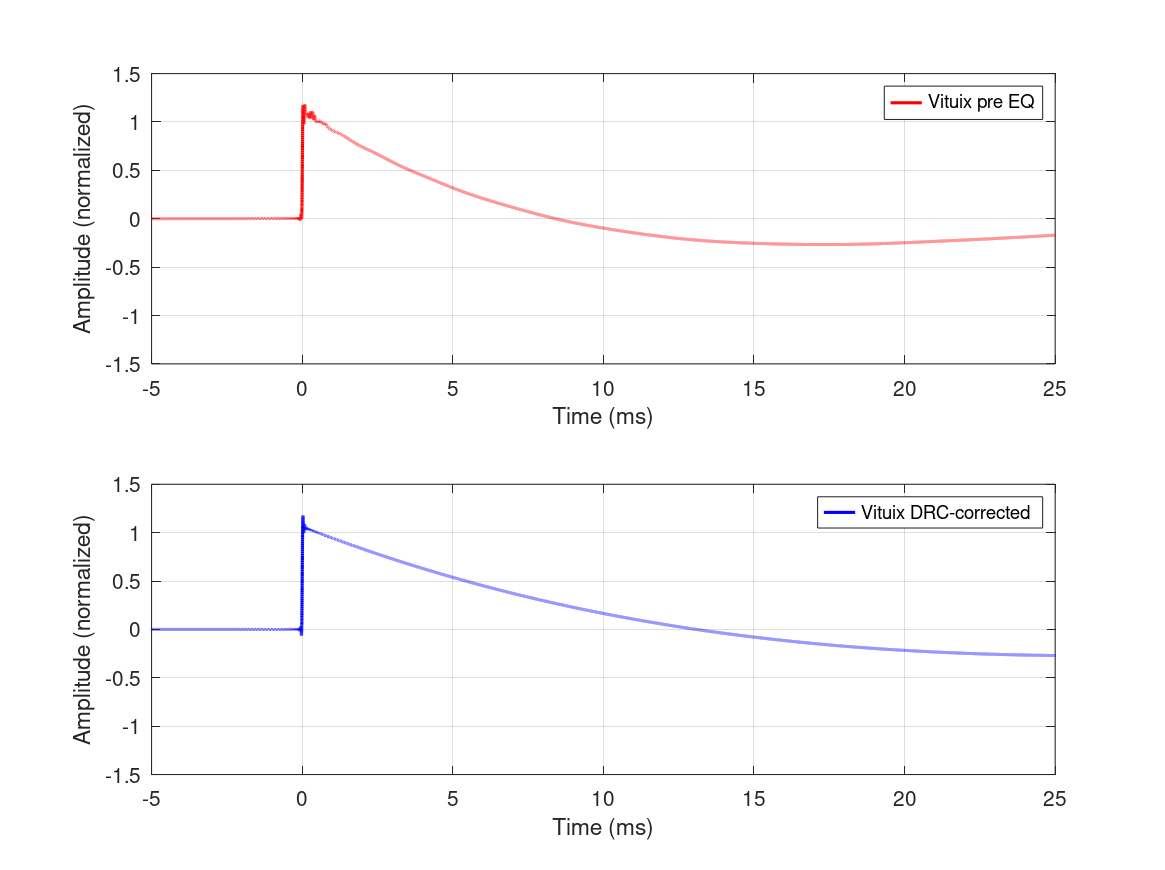
It's odd because it looks like a linear phase DAC anti alias filter which is no problem to be concerned with but in the waterfall it flips from pre to post ringing and in the impulse view it stays in both.
REW has the expected result which makes the other graphs suspect.
REW has the expected result which makes the other graphs suspect.
Last edited:
As said, the rendering of an IR often is different between different programs.
There's definitely some energy before the peak though (at about 22 KHz), it was there in the sim from Vituixcad before running DRC-FIR and I did not intend to remove it, just correct the frequency/phase of the simulation as cleanly as I could get it.
I do think that Octave plot is off.
There's no DAC involved, as it is all sims. ABEC plots used in an array sim, minimum phase EQ done in REW and run trough DRC-FIR. The DRC-FIR template is from 20 Hz up to 22050 Hz, not the usual 20-20000.
Some clever filtering in REW gets you this:
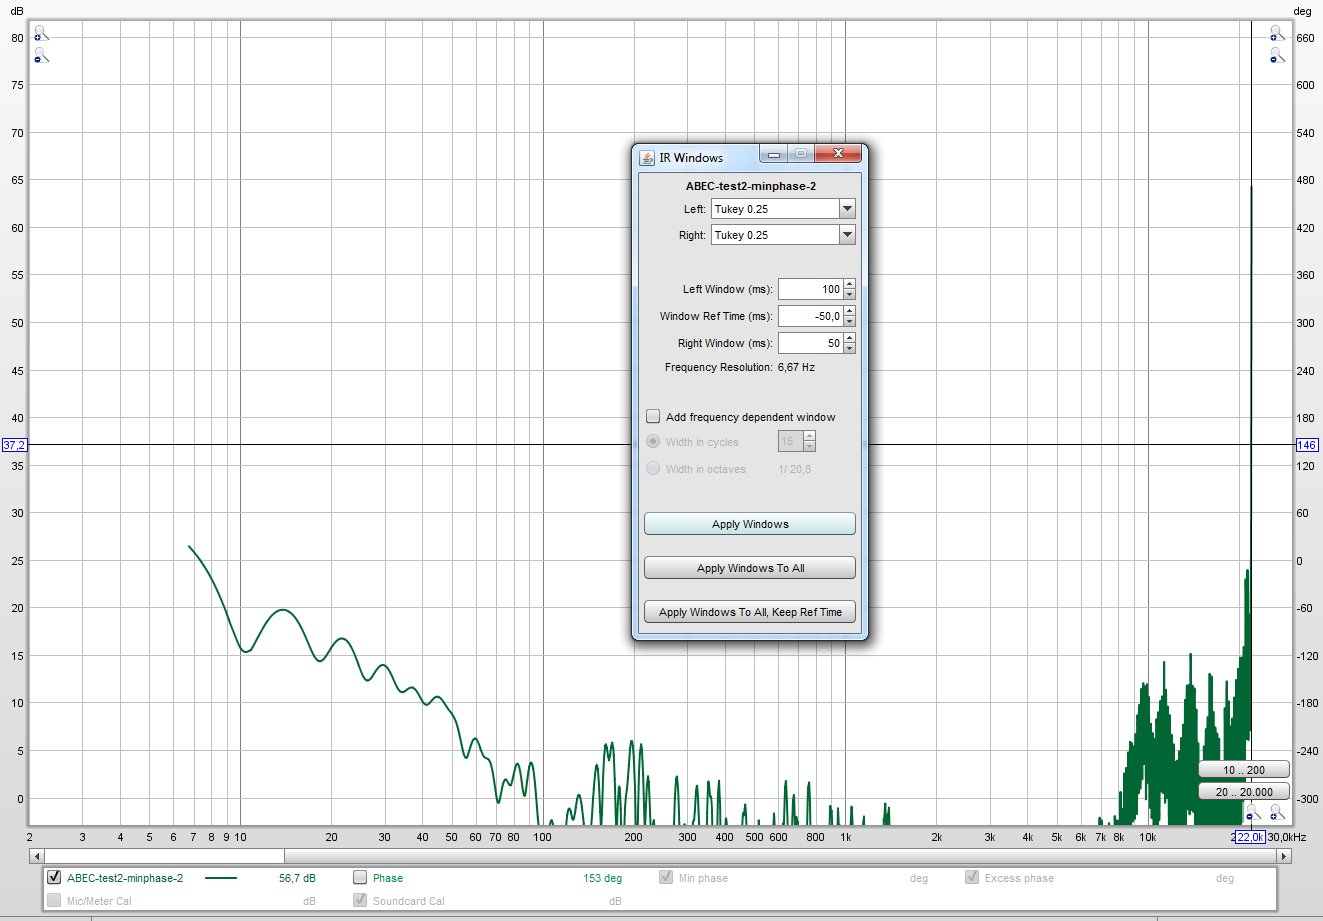
On a true Dirac pulse you get nothing with the same filtering... a neat method to see the pré-pulse energy.
There's definitely some energy before the peak though (at about 22 KHz), it was there in the sim from Vituixcad before running DRC-FIR and I did not intend to remove it, just correct the frequency/phase of the simulation as cleanly as I could get it.
I do think that Octave plot is off.
There's no DAC involved, as it is all sims. ABEC plots used in an array sim, minimum phase EQ done in REW and run trough DRC-FIR. The DRC-FIR template is from 20 Hz up to 22050 Hz, not the usual 20-20000.
Some clever filtering in REW gets you this:
On a true Dirac pulse you get nothing with the same filtering... a neat method to see the pré-pulse energy.
Attachments
Last edited:
- Home
- Loudspeakers
- Full Range
- A convolution based alternative to electrical loudspeaker correction networks