The Octave script for constant Q transform in on the way 😀
- Elias
 🙂
🙂Michael
If I understand correctly, the CLIO implementation is constant Q.
User selects Q.
Yes, that is what it looks like ..
🙂
Michael
Hello,
The new version of RoomEquWizzard (RoomEquWizzard_5) has an intersting spectrogram:
REW V5 Beta Downloads - Pro Audio Forums - ProAudioShack.com
This spectrogram can be diplayed with both false colors lateral illumination and isovalue contours.
An example is there:
http://www.hometheatershack.com/forums/images/spectrogram3d.jpg
You can notice the interesting 3D effect render by that presentation.
Best regards from Paris, France
Jean-Michel Le Cléac'h
Two questions for all of you that know much better than me this topic.
1. as the impulse reponse (vs. time) can be determine by the FT of the pressure (vs. frequancy) (am I right ?), is it possible to get a spectrogram starting from pressure (vs. frequency) ?
2. if the respinse is yes, is there any esplanation on how to do that ? please don't point me any (closed) tool or some code in Matlab: me, I can use Mathcad and Mathematica (I would like to get the same results using those tools) and I don't fear at all even advanced mathemathics (but I don't want to spend the next two years in studying the topic.
Many thanks
Hello,
Pressure/frequency is not suficient you need phase/frequency too.
As an example, the IR calculation module I wrote for Hornresp uses SPL and phase. Then from the obtained IR we can obtain the spectrogram (CSD or quasi wavelets graph...).
Best regards from Paris, France
Jean-Michel Le Cléac'h
Pressure/frequency is not suficient you need phase/frequency too.
As an example, the IR calculation module I wrote for Hornresp uses SPL and phase. Then from the obtained IR we can obtain the spectrogram (CSD or quasi wavelets graph...).
Best regards from Paris, France
Jean-Michel Le Cléac'h
Two questions for all of you that know much better than me this topic.
1. as the impulse reponse (vs. time) can be determine by the FT of the pressure (vs. frequancy) (am I right ?), is it possible to get a spectrogram starting from pressure (vs. frequency) ?
2. if the respinse is yes, is there any esplanation on how to do that ? please don't point me any (closed) tool or some code in Matlab: me, I can use Mathcad and Mathematica (I would like to get the same results using those tools) and I don't fear at all even advanced mathemathics (but I don't want to spend the next two years in studying the topic.
Many thanks
Very good ! I can produce also the phase !
To be more precise I have rewritten the work of MJK on Transmission Line in a more "academic" way. So, as an example, the "minimum phase" condition is respected even in presence of the visco-thermal losses of the air and the acoustic absorbant.
Phase is OK, so I guess I can get a correct spectrogram.
But I don't want to read 1000's of pages to begin to do that, can you point me some bibliography (accesssible on the net) that could help me to start ?
I don't fear mathematics.
Hello,
There is probably a kind of transform that allow to derive directly the spectrogram from pressure/frequency + phase/frequency, but I don't know it.
The best thing is that in a first step you derive the impulse response from pressure/frequency + phase/frequency. I have my own method to do this when a logarithmic frequency scale is used, which is implemented inside Hornresp, so you'll understand that I cannot publish it. But you may eventually use an inverse FFT to recover the impulse response from pressure/frequency + phase/frequency.
Then, you can use a quasi wavelet code to obtain the spectrogram from the impulse response. A free code to calculate a wavelet graph written for Octave has been discussed on that thread ( and I gave also the code of my quasi wavelets graph). Elias and Mige0 are main contributors on that topic.
Best regards from Paris, France
Jean-Michel Le Cléac'h
Very good ! I can produce also the phase !
To be more precise I have rewritten the work of MJK on Transmission Line in a more "academic" way. So, as an example, the "minimum phase" condition is respected even in presence of the visco-thermal losses of the air and the acoustic absorbant.
Phase is OK, so I guess I can get a correct spectrogram.
But I don't want to read 1000's of pages to begin to do that, can you point me some bibliography (accesssible on the net) that could help me to start ?
I don't fear mathematics.
Thanks, I should take the courage of reading (and understanding) 17 pages of this thread.
Given that some of the contributors are Gedlee and JohnK I'm a little bit frightened, but since Gedlee said that this could be done with Mathematica and Mathcad I guess I can afford the task (and perhaps I shall ask for a little help from them ...).
Given that some of the contributors are Gedlee and JohnK I'm a little bit frightened, but since Gedlee said that this could be done with Mathematica and Mathcad I guess I can afford the task (and perhaps I shall ask for a little help from them ...).
Audio Engineering Society Convention Paper
Presented at the 123rd Convention
2007 October 5–8 New York, NY
Time-Frequency Characterization of Loudspeaker Responses Using Wavelet Analysis
Daniele Ponteggia 1, Mario Di Cola
1 Audiomatica, Firenze, 50136, Italy
2 Audio Labs Systems, Milano, 20068, Italy
Correspondence should be addressed to Daniele Ponteggia (dp@audiomatica.com)
Everythign you need to know.
Hello,
In the Hornresp thread, in the message:
http://www.diyaudio.com/forums/subwoofers/119854-hornresp-109.html#post2167471
I proposed to write for the Hornresp software a spectrogram routine inspired by my quasi wavelets routine.
As Hornresp is written in Visual Basic and as we had to keep run time acceptable I had to modified deeply my quasi wavelets routine written in Matlab language. The original gaussian type Fourier window could not be used anymore so I used a simpler window and, with some further optimization the resulting spectrogram brings the same information as the original quasi wavelets graph with very few artifacts due to the used window.
I have to thanks David Mc Bean who accepted to included the routine in Hornresp version 27.00. Read his message:
http://www.diyaudio.com/forums/subwoofers/119854-hornresp-123.html#post2217011
Hornresp version 27.00 is now downloadable for free at:
Telstra BigBlog -
Best regards from Paris, France
Jean-Michel Le Cléac'h
Hello,
The spectrogram in Hornresp has been improved.
The new calculation runs faster and the quality of the spectrogram is much better due to the use of a new Fourier window equivalent to a gaussian window.
See David McBean's message:
http://www.diyaudio.com/forums/subwoofers/119854-hornresp-128.html#post2223790
A test spectrogram is attached to this message
Best regards from Paris, France
I have to thanks David Mc Bean who accepted to included my spectrogram routine in Hornresp version 27.00. Read his message:
http://www.diyaudio.com/forums/subwoofers/119854-hornresp-123.html#post2217011
Hornresp version 27.00 is now downloadable for free at:
Telstra BigBlog -
Attachments
Last edited:
After some rest here, I'd like to further investigate into CMP behaviour by wavelet (or quasi wavelet) analysis.
This should not mainly focus on IR analysis like until now - but rather on development of evenly distributed spectra over time.
Meaning - when a white noise spectrum is fed to a speaker for some time we should see - with low CMP distortion speakers - a single deep red area starting at time 0sec and ending at the time the white noise signal is shut down.
In contrary - with pronounced CMP distortion speakers like OB for example - we should see a deep red area over full frequency spectrum for the time of delay first.
After that we should see the combfilter effect until the white noise signal is shut down .
After shut down we also should see the CMP tail lasting as long as initial delay time.
An thoughts?
Michael
Last edited:
Hello,
This is well analysed with wavelets 🙂 However since white noise can be contsructed with infinite number of sinusoids we can have exact solution. But, if we'd like to analyse a linear system we can still use the impulse response. Only one needs to choose a suitable wavelet for the case in hand.
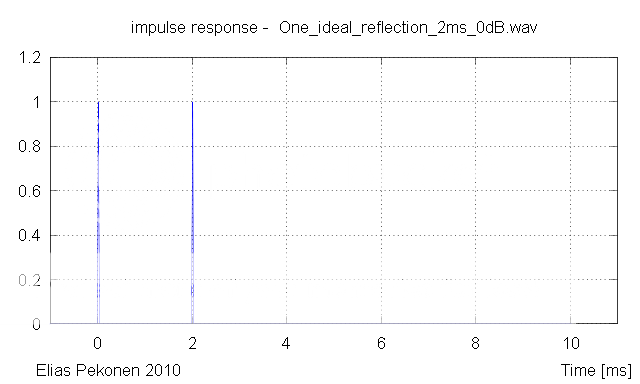
Here's an example of a system having a direct signal and an ideal reflection at 2ms. Level of the reflection is the same as the direct signal.
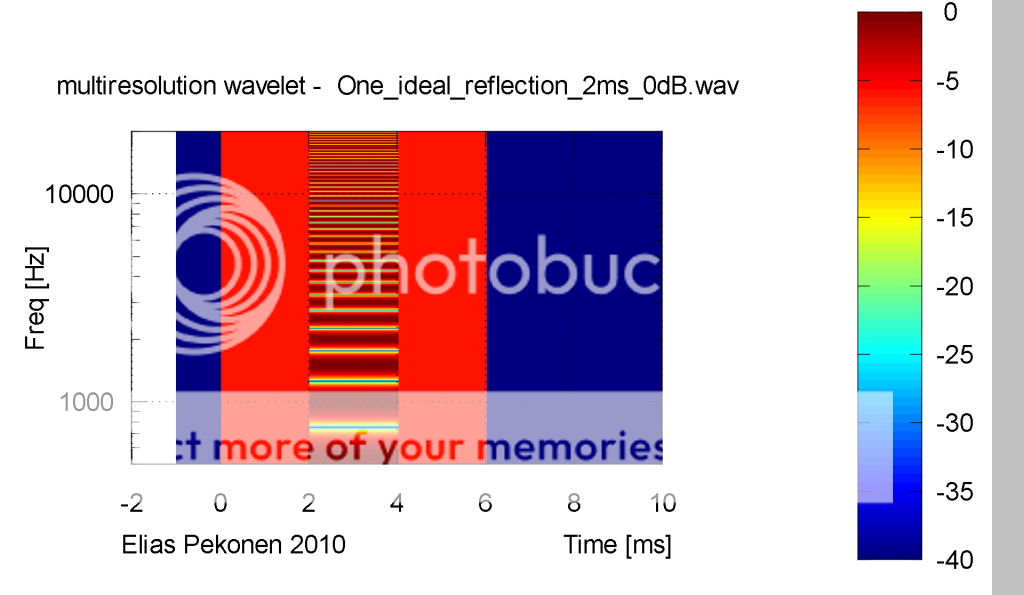
And here's the wavelet transform of the impulse response. Here the wavelet is having rectangular envelope and it's duration is 4ms.
At 0ms the wavelet hits the direct signal and frequency response is flat (red). Note the comb filtering occurs at 2ms when the wavelet hits the reflection. Comb filtering stops at 4ms when the trailing tail of the wavelet passes the direct signal. At 6ms the wavelet has passed the reflection and no signal anymore.
- Elias
This is well analysed with wavelets 🙂 However since white noise can be contsructed with infinite number of sinusoids we can have exact solution. But, if we'd like to analyse a linear system we can still use the impulse response. Only one needs to choose a suitable wavelet for the case in hand.
Here's an example of a system having a direct signal and an ideal reflection at 2ms. Level of the reflection is the same as the direct signal.
And here's the wavelet transform of the impulse response. Here the wavelet is having rectangular envelope and it's duration is 4ms.
At 0ms the wavelet hits the direct signal and frequency response is flat (red). Note the comb filtering occurs at 2ms when the wavelet hits the reflection. Comb filtering stops at 4ms when the trailing tail of the wavelet passes the direct signal. At 6ms the wavelet has passed the reflection and no signal anymore.
- Elias
After some rest here, I'd like to further investigate into CMP behaviour by wavelet (or quasi wavelet) analysis.
This should not mainly focus on IR analysis like until now - but rather on development of evenly distributed spectra over time.
Meaning - when a white noise spectrum is fed to a speaker for some time we should see - with low CMP distortion speakers - a single deep red area starting at time 0sec and ending at the time the white noise signal is shut down.
In contrary - with pronounced CMP distortion speakers like OB for example - we should see a deep red area over full frequency spectrum for the time of delay first.
After that we should see the combfilter effect until the white noise signal is shut down .
After shut down we also should see the CMP tail lasting as long as initial delay time.
An thoughts?
Michael
Yes, this comb filtering effect shows up in the frequency response as well for any kind of diffraction and reflection. It is interesting what things would look like if there are multiple reflections/diffraction in the same window. I currently cannot really see what additional information this so called CMP will show or explain. I guess everyone is learning in different ways.Hello,
This is well analysed with wavelets 🙂 However since white noise can be contsructed with infinite number of sinusoids we can have exact solution. But, if we'd like to analyse a linear system we can still use the impulse response. Only one needs to choose a suitable wavelet for the case in hand.
Here's an example of a system having a direct signal and an ideal reflection at 2ms. Level of the reflection is the same as the direct signal.
And here's the wavelet transform of the impulse response. Here the wavelet is having rectangular envelope and it's duration is 4ms.
At 0ms the wavelet hits the direct signal and frequency response is flat (red). Note the comb filtering occurs at 2ms when the wavelet hits the reflection. Comb filtering stops at 4ms when the trailing tail of the wavelet passes the direct signal. At 6ms the wavelet has passed the reflection and no signal anymore.
- Elias
In contrary - with pronounced CMP distortion speakers like OB for example - we should see a deep red area over full frequency spectrum for the time of delay first.
Michael
Here is a burst response for my Nao Note (OB speaker). The burst response is the same thing as a wavelet but the time axis is normalized to periods and the width of the burst is fixed in periods. Anyway, where is the CMP distortion?
An externally hosted image should be here but it was not working when we last tested it.
All there is of significants is the room reflection at 4 msec.
Here is the first 3 msec of the impulse (to exclude the room reflection).
An externally hosted image should be here but it was not working when we last tested it.
How does this look any different than any other multiway speaker?
Hello John K...
Would it be possible for you to post the impulse response file of Nao Note, either in WAV, or ARTA txt file? I can try to process that with wavelets.
- Elias
Would it be possible for you to post the impulse response file of Nao Note, either in WAV, or ARTA txt file? I can try to process that with wavelets.
- Elias
Hello John K...
Would it be possible for you to post the impulse response file of Nao Note, either in WAV, or ARTA txt file? I can try to process that with wavelets.
- Elias
I only have the demo version of ARTA so I can not export the impulse.
I would add that it should be clear from the impulse that there is no significant second impulse. The equalized dipole is not a double impulse system when the bandwidth is limited to below the dipole peak, a point I have made over and over. There are small secondary "glitches" in my impulse which arise from reflections/diffraction from other sources. But these are generally more than 30 to 35 dB below the peak of the burst.
Last edited:
Hello,
To illustrate John's sentence, I generated using Adobe audition a signal made of a first positive impulse and a delayed negative pulse (delay around 2 ms).
The (first) peak visible on the FFT spectrum of that signal is at 250Hz.
Then I filtered with a brickwall lowpass at Fc = 250Hz.
The result is marked dipole filterd on the screen copy (see attached graph). The height of the pulse is something like 1.4% of the height of the unfiltered original signal.
We can compare it to the filtered monopole (same process but on a single positive pulse).
Then I used Arta to import the filtered dipole signal and you'll see the frequency response curve (unequalized), the phase curve and the group delay curve.
Best regards from Paris, France
Jean-Michel Le Cléac'h
The equalized dipole is not a double impulse system when the bandwidth is limited to below the dipole peak, a point I have made over and over.
Attachments
- Status
- Not open for further replies.
- Home
- Loudspeakers
- Multi-Way
- WTF!? Wavelet TransForm for audio measurements - What-is? and How-to?