Octave will work, I guess, under Vista just the same - but you will have hard times to work on code as the Windows (GUI-) versions of Octave I've tried, do not provide the same complete coding environment as QtOctave under Linux does.
http://qtoctave.files.wordpress.com/2007/10/2007-10-30-qtoctave-portable.png
Give it a try with Elias' code first, as this one seems to be native Octave code, whereas Jean-Michel's is Matlab code that does not run smooth from scratch.
You should get exactly the same plots as Elias has shown us in the intro of that thread - besides a little different formatting of x-axis (which is quite easy to correct if you like).
I gave SciLab with Jean- Michel's code a try too, but the Matlab converter there didn't get around to translate the code correctly - so I gave up with SciLab for the moment.
Michael
Last edited:
Here is my first rudimentary version of the modular "Diy Audio WTF" package - intended to make starting into wavelet audio analysis easier.
(well, at least as soon its more complete than right now... 😀)
http://www.kinotechnik.edis.at/pages/diyaudio/GD_HighPass/honk_wanted/octave/start_wavelet.ZIP
It packs what we have for now, with an improved file loading from what I have written in
http://www.diyaudio.com/forums/soft...ltiresolution-wavelet-analysis-available.html


By processing "start_wavelet" the user is prompted for a file to import.
Currently there is choice of import
- 16bit WAV file
- 32bit WAV file
- two column plain text file
- one column plain text file
To have a check for valid import there is a impulse response plot shown and a rudimentary frequency response plot too (no smoothing, no windowing).
Package seems to run smooth under QtOctave (Linux) and XOctave (Windows) on my hardware.
Any comments and further development of existing or additional modules and bridging to Elias' or Jean-Michel's wavelet analysis is highly welcome of course.
🙂
Michael
(well, at least as soon its more complete than right now... 😀)
http://www.kinotechnik.edis.at/pages/diyaudio/GD_HighPass/honk_wanted/octave/start_wavelet.ZIP
It packs what we have for now, with an improved file loading from what I have written in
http://www.diyaudio.com/forums/soft...ltiresolution-wavelet-analysis-available.html
By processing "start_wavelet" the user is prompted for a file to import.
Currently there is choice of import
- 16bit WAV file
- 32bit WAV file
- two column plain text file
- one column plain text file
To have a check for valid import there is a impulse response plot shown and a rudimentary frequency response plot too (no smoothing, no windowing).
Package seems to run smooth under QtOctave (Linux) and XOctave (Windows) on my hardware.
Any comments and further development of existing or additional modules and bridging to Elias' or Jean-Michel's wavelet analysis is highly welcome of course.
🙂
Michael
Last edited:
Thank you Michael!!
I will download XOctave and give it a try on vista...well atleast figure out what I need to do to get it to connect to octave. Path's etc..
I will download XOctave and give it a try on vista...well atleast figure out what I need to do to get it to connect to octave. Path's etc..
it worked...I get this, which looks right
but I get this, it looks strange.

An externally hosted image should be here but it was not working when we last tested it.
but I get this, it looks strange.
An externally hosted image should be here but it was not working when we last tested it.
Seems Octave installation on Vista was easy?
Whats your IR file ?
Remember, the frequency plot is nowhere near what we usually see - as outlined - no windowing - no smoothing, might be I even did a gross mistake...
You know I'm neither a math head nor experienced in digital signal processing - I'm just the monkey that likes to press buttons and enjoy beautiful pictures... 😉
I might refine FR plot later on, but currently I'd rather like to focus on bridging to Elias' code.
Michael
Last edited:
Seems Octave installation on Vista was easy?
Whats your IR file ?
Remember, the frequency plot is nowhere near what we usually see - as outlined - no windowing - no smoothing, might be I even did a gross mistake...
You know I'm neither a math head nor experienced in digital signal processing - I'm just the monkey that likes to press buttons and enjoy beautiful pictures... 😉
I might refine FR plot later on, but currently I'd rather like to focus on bridging to Elias' code.
Michael
lol, you and me both the saddest part for me is that I have a mathematics degree (major in Applied mathematics (20 years ago) )😱
Octave was easy and I had it running before this, I was able to run Elias script before also. Installing XOctave was easy too. The hardest part was setting the Octave path the the octave program. Also moving the wave file into the Ocative directory so it could recognize it.
Ignore the FR plot for now. The IR looked fine from my wave file I imported. Im going to run new measurements to ensure my wave file is legit comparing it against a IR text file. I will expand that plot too because its probably accurate just need to see < 1K Hz.
I have been trying to use your Wave conversion stuff and moving it into Elias's script...I get errors but Im close.
Again thanks for your work, I believe Im very close to having those pretty pictures.
LoL - "me the totally blind and you the one-eyed at least" - great ! 
😀
I'm looking forward to what you are coming up with ! Keep your code modular, if possible...
😉
Michael
😀
I'm looking forward to what you are coming up with ! Keep your code modular, if possible...
😉
Michael
Last edited:
Hi,
 I see many colors! 😀
I think the most difficult part of coding is to make an UI. I never used any GUI for Octave. I write all my code in Notepad and run them from the command line. It works every time 😀
Usually I enter parameters to the run by using another .txt file where the parameters are listed (with comments) and the core code eats the file and processes the parameters.
Good idea! Don't do like me 😱 🙄
P.S. the freq plot may work better if you take abs before the log10
ftx_db= 20*log10(ftx); % amplitude in dB
should be
ftx_db= 20*log10(abs (ftx)); % amplitude in dB
if you take logarithm from a complex number the result can be rather interesting 🙂
- Elias
I see many colors! 😀I think the most difficult part of coding is to make an UI. I never used any GUI for Octave. I write all my code in Notepad and run them from the command line. It works every time 😀
Usually I enter parameters to the run by using another .txt file where the parameters are listed (with comments) and the core code eats the file and processes the parameters.
Keep your code modular
Good idea! Don't do like me 😱 🙄
P.S. the freq plot may work better if you take abs before the log10
ftx_db= 20*log10(ftx); % amplitude in dB
should be
ftx_db= 20*log10(abs (ftx)); % amplitude in dB
if you take logarithm from a complex number the result can be rather interesting 🙂
- Elias
I think the most difficult part of coding is to make an UI. I never used any GUI for Octave. I write all my code in Notepad and run them from the command line. It works every time
Usually I enter parameters to the run by using another .txt file where the parameters are listed (with comments) and the core code eats the file and processes the parameters.
Ha, You should consider something like ultraedit....its sweet editing (code) tool.
Btw, when we prototype, we type line after line testing the code, screen capturing it all into a text file. 😀
Fun stuff guys, I haven't had more time to try and get from Micheal's to Elias's finally product yet but I think Im close.
Well Im stuck, I get this message
"Error: memory exhausted or requested size too large for range of octave's index type"
Im trying to run this
Elias sample only had 5 frequencies and 2001 time samples. My wave file has 20001 time samples and 20001 frequencies.
I guess that would be a HUGE array.
Maybe I will run it for 1/5th of the samples and see what the max limit on Octave is.
"Error: memory exhausted or requested size too large for range of octave's index type"
Im trying to run this
Code:
for i = 1 : length(f)
	ftx (:, i) = e.^(2*pi*j*f(i)*t).*e.^(-t.^2/(2*tb^2));
endfor
Elias sample only had 5 frequencies and 2001 time samples. My wave file has 20001 time samples and 20001 frequencies.
I guess that would be a HUGE array.
Maybe I will run it for 1/5th of the samples and see what the max limit on Octave is.
To my limited understanding, the wavelet is "scanning" for frequencies available.
If so - how do you get form the plain time domain data - IR that is - to the required *clean* frequency domain data ? - or is it enough to present a raw FFT and let the wavelet make the pick ?
Michael
If so - how do you get form the plain time domain data - IR that is - to the required *clean* frequency domain data ? - or is it enough to present a raw FFT and let the wavelet make the pick ?
Michael
Last edited:
Im just going off Elias demo...and replacing his demo values with my actually response values.
His values are
and I have the Fs, time and frequency from my wave file. I need to convert the frequency to his variable type though. Mine is not in an array variable like his.
That is where Im really stuck.
His values are
Code:
Fs = 100000;

t = (-1000 : 1000)/Fs;

f(1) = 100;
f(2) = 316;
f(3) = 1000;
f(4) = 3160;
f(5) = 10000;
and I have the Fs, time and frequency from my wave file. I need to convert the frequency to his variable type though. Mine is not in an array variable like his.
That is where Im really stuck.
Hi,
the waveletdemo.m do not calculate the wavelet transform yet, it only generates the wavelets. Next one needs to transform the data (impulse response) to the 'wavelet domain'.
I'm working on an example how to calculate with the IR file..
- Elias
the waveletdemo.m do not calculate the wavelet transform yet, it only generates the wavelets. Next one needs to transform the data (impulse response) to the 'wavelet domain'.
I'm working on an example how to calculate with the IR file..
- Elias
Hello,
I thought a short example how to calculate the transform would be ok 🙂
In the beginning there was an impulse response:
And there was a wavelet:
We combine them through the transform:
And have this:
where
blue = wavelet
green = transform of the wavelet and the impulse response
red = envelope of the wavelet
magenta = envelope of the transform
Now the envelope is the interesting one which is better to see on the dB scale:
where again
red = envelope of the wavelet
magenta = envelope of the transform
Next thing to do is to repeat the above at every frequency of interest. And after making another visit to the indian bazaar one has for example this plot:
- Elias
I thought a short example how to calculate the transform would be ok 🙂
In the beginning there was an impulse response:
An externally hosted image should be here but it was not working when we last tested it.
And there was a wavelet:
An externally hosted image should be here but it was not working when we last tested it.
We combine them through the transform:
And have this:
An externally hosted image should be here but it was not working when we last tested it.
where
blue = wavelet
green = transform of the wavelet and the impulse response
red = envelope of the wavelet
magenta = envelope of the transform
Now the envelope is the interesting one which is better to see on the dB scale:
An externally hosted image should be here but it was not working when we last tested it.
where again
red = envelope of the wavelet
magenta = envelope of the transform
Next thing to do is to repeat the above at every frequency of interest. And after making another visit to the indian bazaar one has for example this plot:
An externally hosted image should be here but it was not working when we last tested it.
- Elias
Hi,
the waveletdemo.m do not calculate the wavelet transform yet, it only generates the wavelets. Next one needs to transform the data (impulse response) to the 'wavelet domain'.
Hadn't got around to merge yours and JMLC examples to perform that task😉
I'm working on an example how to calculate with the IR file..
Hello,
I thought a short example how to calculate the transform would be ok 🙂
Thanks, highly appreciated !
Its like searching the Easter eggs anyway !
😀
Michael
Last edited:
Hello Michael,
Congratulations, You are going fast. 🙂)
Due to some reborn interest from my part for that old quasi wavelets Matlab routine I once wrote, I am currently modifying it in order to make it more user friendly.
1) in the old version in order to center the pulse inside the signal window, I used a convolution with a quasi-wavelet (gaussian pulse) having a center frequency of 1000Hz. So in the case the impulse response didn't have any 1000Hz component there was some problem. In the new version, I take the frequency for which the abs(FFT) is max as the frequency used in order to center the IR in the signal window.
2) If I want the spectrogram to be normalized. I run a first quasi-wavelets spectrogram then I extract the max of the spectrogram at each frequency, then I divide the lines of the spectrogram ( = given frequencies) by those max in order to obtain the normalized quasi-wavelets spectrogram.
3) I developped a module in order to have in the same time on the same spectrogram the visualisation of both the module and the phase (in reality only the sign of the phase is used in order to simplify the visualisation). It is more useful though for the polarity check in multiways system than for our honk source study...
If there is some interest for you I'll send the code to you as soon as possible (it is on another computer at home...)
Best regards from Paris, France
Jean-Michel Le Cléac'h
Finally arrived 😀
it takes some time if you have to start from scratch installing and getting familiar with an "new" OS first.
Below we see the first "bunch of pretty pictures" I got - adapting Jean-Michel's code to QtOctave, to process my four honkers
Those visualisations of my out door measurements are not perfect yet - as can be see – but, I'm loving it, and not having expected to catch up the many years of experience with Matlab / Octave of Elias or Jean-Michel in a few days anyway.
Last edited:
Hello Zilchlab,
There is something I don't like in Keele's paper (page 7 on top) it is the recommeandation to use FFT.
In fact FFT could be interesting in such spectrograms if the frequency scale was linear but for audio analysis better to use a logarithmic frequency scale, in that case 300 frequency steps are equivalent to more than 32000 linearly spaced frequencies. In that case DFT is rapid.
The dimension of the spectrogram (= matrix) can be 300 x 700 (e.g) with DFT but with FFT it could be 32000 x 700.
That's why for most of my own audio analysis tools I prefer Discrete Fourier Transform (DFT) to FFT .
Best regards from Paris, France
Jean-Michel Le Cléac'h
Hello,
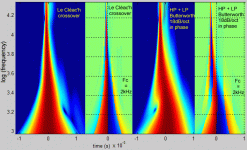
In order to illustrate the possibility of visualisation of both the amplitude and phse on a spectrogram, I attached a graph where the quasi wavelets of the IR resulting from the summation of a low-pass and and high pass crossover is shown. On left a Le Cléac'h crossover, on right a Butterworth 3rd order (LP and HP in same polarity).
I have to ameliorate somewhat the look-up table (LUT) in order to improve the visualsiation, but I think that new kind of graph may be useful in certain cases.
Best regards from Paris, France
Jean-Michel Le Cléac'h
3) I developped a module in order to have in the same time on the same spectrogram the visualisation of both the module and the phase (in reality only the sign of the phase is used
Attachments
Jean-Michel,
I don't get the phase plot. Is that a phase versus time at each particular frequency? If I put a wavelet through a filter I don't get abrupt phase changes like I'm interpreting from your graph.
- Elias
I don't get the phase plot. Is that a phase versus time at each particular frequency? If I put a wavelet through a filter I don't get abrupt phase changes like I'm interpreting from your graph.
- Elias
Hello,
In order to illustrate the possibility of visualisation of both the amplitude and phse on a spectrogram, I attached a graph where the quasi wavelets of the IR resulting from the summation of a low-pass and and high pass crossover is shown. On left a Le Cléac'h crossover, on right a Butterworth 3rd order (LP and HP in same polarity).
I have to ameliorate somewhat the look-up table (LUT) in order to improve the visualsiation, but I think that new kind of graph may be useful in certain cases.
Best regards from Paris, France
Jean-Michel Le Cléac'h
- Status
- Not open for further replies.
- Home
- Loudspeakers
- Multi-Way
- WTF!? Wavelet TransForm for audio measurements - What-is? and How-to?