Hello Elias,
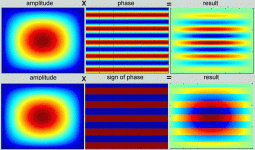
One of the advantages of my quasi-wavelets method is that it delivers both amplitude and phase at each frequency/time couple.(Because I use 2 convolutions one with a gaussian cosine pulse , the other one with a gaussian sine pulse.)
Then the difficult thing is the visualisation of both on the same graph.
Give a look to the attached graph (a theorical simplistic case that I use to optimize the LUT).
In the upper row you have the amplitude spectrogram on left, the phase spectrogram on middle and the result from the multiply on right. It is quite difficult to analyze that graph (please note the wavy isochrome contours)
That's why I prefer to use only the sign of the phase (bottom row in the middle) to multiply the amplitude spectrogram. I find the result more easy to analyse (see bottom right).
Best regards from Paris, France
Jean-Michel Le Cléac'h
I don't get the phase plot. Is that a phase versus time at each particular frequency? If I put a wavelet through a filter I don't get abrupt phase changes like I'm interpreting from your graph.
Attachments
Last edited:
Hi,
I tried the phase plot too
From this amplitude plot:
one get this phase plot:
Staring at the phase plot makes my eyes hurt 😀 If I were into cubism I would propably hang that on the wall
Now the question is what we can learn from the phase plot that is not observable from the amplitude plot?
The benefits of a group delay are more clear than the phase, I think.
- Elias
I tried the phase plot too
From this amplitude plot:
An externally hosted image should be here but it was not working when we last tested it.
one get this phase plot:
An externally hosted image should be here but it was not working when we last tested it.
Staring at the phase plot makes my eyes hurt 😀 If I were into cubism I would propably hang that on the wall
Now the question is what we can learn from the phase plot that is not observable from the amplitude plot?
The benefits of a group delay are more clear than the phase, I think.
- Elias
Last edited:
Hello Elias
Your graph hurts because that only phase and because phase being defined everywhere on the plane frequency/time you have colors everywhere.
That's why I never shown any phase graph but I shown an hybrid graph which is the result of the product between amplitude and phase. In that case if the amplitude tend toward zero then the product phase by amplitude do the same... the graph doesn't hurt anymore.
As I wrote in a recent message I don't think such hybrid graph will be useful to characterize a single driver (in the hypothesis it is a minimum phase device) but it will be more useful when aligning acoustic centers and choosing the settings of the crossover in a mutiways system. (In that case the behaviour of the system is often non minimum phase...).
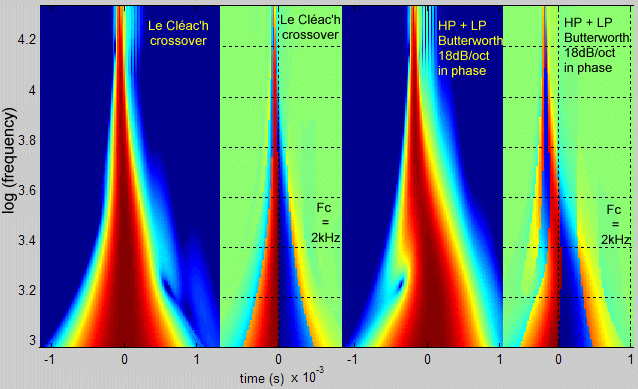
Even to study simples 2 ways crossovers I find it interesting as in the example I gave:
http://www.diyaudio.com/forums/atta...audio-measurements-what-how-wavelet_phase.gif
on which we can see what frequency ranges are out of phase with others.
Best regards from Paris,
Your graph hurts because that only phase and because phase being defined everywhere on the plane frequency/time you have colors everywhere.
That's why I never shown any phase graph but I shown an hybrid graph which is the result of the product between amplitude and phase. In that case if the amplitude tend toward zero then the product phase by amplitude do the same... the graph doesn't hurt anymore.
As I wrote in a recent message I don't think such hybrid graph will be useful to characterize a single driver (in the hypothesis it is a minimum phase device) but it will be more useful when aligning acoustic centers and choosing the settings of the crossover in a mutiways system. (In that case the behaviour of the system is often non minimum phase...).
Even to study simples 2 ways crossovers I find it interesting as in the example I gave:
http://www.diyaudio.com/forums/atta...audio-measurements-what-how-wavelet_phase.gif
on which we can see what frequency ranges are out of phase with others.
Best regards from Paris,
phase plot:
An externally hosted image should be here but it was not working when we last tested it.
... the phase plot makes my eyes hurt
Now the question is what we can learn from the phase plot that is not observable from the amplitude plot?
Those overlaid frequency / phase plots are really interesting !
The LeCleach XO topology looks great too.
Where do the reflections at the top end come from ? - I think this are electric measurements - no ?
#############
For *loudspeaker measurements* possibly overlaying only a dotted line where the phase changes sign may be less irritating then overlaying colors - if this can be done easily ?
Elias your phase plot looks like coral reef - beautiful but irritating!
Michael
Last edited:
I have been following this thread loosely but frankly I am having a hard time seeing the differences between all this and shaped burst testing. Shaped burst testing can be considers to be looking at the response of a system to one cycle of a 100% amplitude modulated signal where the ratio between the signal frequency, fs, and the carrier frequency, fc, are kept constant. This makes the duration of the burst vary as 1/fs, and the result is plotted as a function of carrier frequency. For an N cycle burst, fs = fc/N. If you want to keep the duration of the pulse constant then fs = constant and the carrier frequency is allowed to increase as the testing frequency. That is, the number of cycles per burst increases as the carrier frequency increases. If, for example, fs = 50 Hz then when fc = 100 there are 2 cycles/burst and when fc = 1k Hz there are 20 cycles per burst and at 10K Hz there are 200. The result is again plotted as a function of fc.
The problem is that as the carries frequency gets large the relevant time scales with respect to system behavior are those of the carrier, not the signal. Thus if fs is held constant which fc varies the response is more or less the quasi-steady response and transient information will not be clearly observable. If the ratio of fs to fc is held constant, then the time scale can be normalized by 1/fc (as is done in ARTA shaped burst plots) and the the monogram becomes more meaningful as the time scale decreases as frequency increases. Even the typical CDS plot would be more meaningful if the time axis was scaled by 1/f.
Now if I have missed something forgive me. As I said, I have only been following this post loosely.
Hi John, happy you chime in .
Analyzing impulse response files has the big advantage that those measurements / files are very common.
Possibly with some specialized measurements methods we could gain even better plots - dunno.
To split measurement and analysation / visualisation for the matter isn't optimal - nor is the need to get familiar with a math processing tool like Octave.
Do you see any chance to get wavelet analysis integrated into SE ?
For now there is only Clio and AutoSignal wavelet analysis from commercial packages I know of - both software way too expensive for the diy'er interested in horns.
As for bust decay - this (and CSD) has been explored and compared with more extensively in the beginning of horn honk thread
For example:
http://www.diyaudio.com/forums/multi-way/161627-horn-honk-wanted-8.html#post2126865
CSD and burst decay simply is not in the same league - Elias' multi resolution wavelet analyzation / visualisation is way the best we have for now IMO.
Michael
Last edited:
Now if I have missed something forgive me. As I said, I have only been following this post loosely.
John you are precisely correct, the end result is identical, its just the order of things that differs. In general I prefer any measurement to first result in the impulse response. Then the processing afterwords can take on many forms, like wavelets, CSD, frequency response, whatever. The impulse response contains all the data (linear, although one can also obtain nonlinear order impulses as well) that can be obtained from that system. With the shaped burst testing, you do not get the impulse response, you are jumping directly to the wavelet smoothed response.
It's been a while since I studied any mathematics. Is it correct to assume that the wavelets are an orthogonal (or orthonormal) set of basis functions, like the sin and cos terms in a Fourier series expansion?
Can someone recommend a good book to look at?
Thanks,
John
Can someone recommend a good book to look at?
Thanks,
John
Going back to Elias' first post http://www.diyaudio.com/forums/mult...-audio-measurements-what-how.html#post2134729, I am sorry but I don't see the difference between the wavelets as shown here,
and, as I said, a single cycle of an AM signal with 100% modulation where the signal frequency is fixed and the carrier is variable. The wavelet is a burst. The rest is just convolution with the impulse.
Here is a form for a 100% modulated AM signal,
Y(t) = (A + M cos(2Pi Fs t + Phi)) x C cos(2PI Fc x t)
The signal is M cos(2PI Fs t) and the carrier is C cos(2PI Fc t). If A = M the modulation is 100%, C is the amplitude of the carrier. If A = M = 1, Phi = Pi, and C = 1/2, then for 0 < t < 1/Fs this will yield similar wave forms to those shown in the plot for Fs = 100 and Fc = 100, 316, 1000, 3160, 10000. On the other hand, if the ratio Fc/Fs = N is held constant as Fc varies, then we have a standard N cycle burst. The rest is convolution of the wavelet with the system impulse response and how you plot it. (As Earl said, and as I ahve always said, measure the impulse response and the rest is post processing. SoundEasy displays burst response in just than manner: measured impulse convolved with the burst wavelet.)
Now my point would be that if the wavelet has a "carrier" frequency of 10 K Hz it is because you are interested in the behavior of the system around 10 k Hz and interested in whether or not there are resonances near that frequency. But the time scale of a resonance with a peak frequency of fp is on the order of 1/fp. To put it another way, you don't look at transients by applying signals of slowly varying amplitude which is what you have if Fs = 100 and Fc = 10,000. The resulting envelope of the output is more indicative of the steady state amplitude response of the system, not the transient.
Anyway, I believe it would be a pretty simple matter to include such a mod in SoundEasy if Bohdan was incline to do so. But plotting in the form of a monogram would be the bigger effort.
An externally hosted image should be here but it was not working when we last tested it.
and, as I said, a single cycle of an AM signal with 100% modulation where the signal frequency is fixed and the carrier is variable. The wavelet is a burst. The rest is just convolution with the impulse.
Here is a form for a 100% modulated AM signal,
Y(t) = (A + M cos(2Pi Fs t + Phi)) x C cos(2PI Fc x t)
The signal is M cos(2PI Fs t) and the carrier is C cos(2PI Fc t). If A = M the modulation is 100%, C is the amplitude of the carrier. If A = M = 1, Phi = Pi, and C = 1/2, then for 0 < t < 1/Fs this will yield similar wave forms to those shown in the plot for Fs = 100 and Fc = 100, 316, 1000, 3160, 10000. On the other hand, if the ratio Fc/Fs = N is held constant as Fc varies, then we have a standard N cycle burst. The rest is convolution of the wavelet with the system impulse response and how you plot it. (As Earl said, and as I ahve always said, measure the impulse response and the rest is post processing. SoundEasy displays burst response in just than manner: measured impulse convolved with the burst wavelet.)
Now my point would be that if the wavelet has a "carrier" frequency of 10 K Hz it is because you are interested in the behavior of the system around 10 k Hz and interested in whether or not there are resonances near that frequency. But the time scale of a resonance with a peak frequency of fp is on the order of 1/fp. To put it another way, you don't look at transients by applying signals of slowly varying amplitude which is what you have if Fs = 100 and Fc = 10,000. The resulting envelope of the output is more indicative of the steady state amplitude response of the system, not the transient.
Anyway, I believe it would be a pretty simple matter to include such a mod in SoundEasy if Bohdan was incline to do so. But plotting in the form of a monogram would be the bigger effort.
It's been a while since I studied any mathematics. Is it correct to assume that the wavelets are an orthogonal (or orthonormal) set of basis functions, like the sin and cos terms in a Fourier series expansion?
Can someone recommend a good book to look at?
Thanks,
John
This is precisely correct. There are lots of books and wavelets are available in most analysis packages like MathCAD and Mathmatica. But lets not all run off and wvae "The Wavelet" flag. Keele, for one, studied them a long time ago. In the end he found that there was nothing that one could see with wavelets that couldn't be see with tradition techniques. Its simply a more consise way of doing things - because they are orthogonal!! But don't think for one minute - like John says - that anything new is going to come of this because it won't. But I will agree that wavelets have a more precise and mathematical deffinition than say CSD or burst sine waves, they are the same thing, but one has a more compact deffinition.
It's been a while since I studied any mathematics. Is it correct to assume that the wavelets are an orthogonal (or orthonormal) set of basis functions, like the sin and cos terms in a Fourier series expansion?
Can someone recommend a good book to look at?
Thanks,
John
There is not too much material out there about wavelet analysis considering the technique isn't any new. Most you will find related to picture processing but way less to professional audio processing.
My guess is that people don't like such intense plots to read – a FR is certainly easier to interpret !
Here I've put together some sources I've found helpful, many further references are made there too :
http://www.diyaudio.com/forums/multi-way/161627-horn-honk-wanted-8.html#post2127827
The main difference in wavlet based analysis it that we can have (in theory and as shown by the examples) increased resolution compared to Fourier based analysis (waterfall / CSD sonogram that is ).
I'm certainly not the math head to explain why exactly this is (any further as said ) but you can look up here - if you are interested :
- help file of AutoSignal Software (seriousely !)
- http://www.hpl.hp.com/techreports/92/HPL-92-124.pdf
- Wave:Wavelets 1
- ION Script: Wavelets
- Computational Toolsmiths WavBox Page
- THE WAVELET TUTORIAL PART I by ROBI POLIKAR
- A Really Friendly Guide To Wavelets
This is for quiet hours...
🙂
Michael
Last edited:
SoundEasy displays burst response in just than manner: measured impulse convolved with the burst wavelet.)
…....
Anyway, I believe it would be a pretty simple matter to include such a mod in SoundEasy if Bohdan was incline to do so. ..
I bought Sound Easy, not a too long time ago, as I was specifically interested in that analysis.
To my pity, after having it and checking out - no demo version available ! - I found no way to import impulse response files to process them any further….
🙁
Michael
Last edited:
But don't think for one minute ... that anything new is going to come of this because it won't.
Think, you are just kept imprisoned by your mantras ...
🙂
Michael
I personally think the value of wavelets is evaluation of performance using music signals. The process would be to evaluate the difference between wavelet of input and output. The closer the match, the better fidelity.
But plotting in the form of a monogram would be the bigger effort.
How could this actually look like?
What we are – or at least I am – interested in, is to have a analysis / visualisation of frequency response changes over time – hence the time-frequency plots of wavelet anaylsis.
The reason behind, is to finally see how reflection *and re-reflection* of horns provide a characteristic sonic pattern related to more or less pronounced quarter wave behaviour of that specific contour used.
In an optimal visualisation IMO we would be able to see a quasi ideal FR (depending on driver used) at t = zero and further out on the time line – as soon as quarter wave reflections occur – we should see the typical ripples in FR caused by comb filtering.
A – pretty non-perfect - picture for this sonic behaviour I'm after - I've shown here:
http://www.diyaudio.com/forums/multi-way/161627-horn-honk-wanted-8.html#post2127735

We can clearly see the *grid structure* of the comb filtering of that short transmission line measured here.
This plot is set to linear frequency axis to emphasis on that BTW.
Sadly the time- frequency resolution isn't good enough to show a non-compromised T = zero frequency response as well
.
This IMO *requires* the multi resolution technique shown by Elias, which is – to my understanding – an overlay of analysis with different time-frequency trade off's.
This "multi resolution plots" have been introduced by Elias around here:
http://www.diyaudio.com/forums/multi-way/161627-horn-honk-wanted-6.html#post2122009
An externally hosted image should be here but it was not working when we last tested it.
Michael
Last edited:
I personally think the value of wavelets is evaluation of performance using music signals. The process would be to evaluate the difference between wavelet of input and output. The closer the match, the better fidelity.
But this is possible with many techniques. Many people in the hearing aid business swear by Coherence using real world signals as being very close to the perceived performance. Wavelets could not do coherence and hence would be highly susceptable to output noise contaminating the results. (I heard someone say that wavelets were immune to noise which is incorrect.) Coherence is fairly imune to this problem
.... The process would be to evaluate the difference between wavelet of input and output. The closer the match, the better fidelity.
Thats exactly the point - here too ....
😀
Michael
Hello John,
Don't forget the imaginary part of the wavelet, it's a complex signal not a real like a shaped tone burst. I didn't plot imaginary part in the picture to keep things simple and understandable, but maybe I should have. Complex signal brings a lot of benefits to the mathematics.
One can use 'real world' bursts too by playing them through your system. I've done this also. The benefit of this is that you can listen how your system sounds like under the exitation. It is a remarkable benefit, sure. But that's about all the benefit it has.
Wavelets give you all (and more actually) you can have from Fourier based methods of analysing signals. This not only applies for studying impulse responses, but for any signal. I would say, loosely defined, Fourier is a subset of wavelet analysis.
- Elias
Going back to Elias' first post http://www.diyaudio.com/forums/mult...-audio-measurements-what-how.html#post2134729, I am sorry but I don't see the difference between the wavelets as shown here,
An externally hosted image should be here but it was not working when we last tested it.
and, as I said, a single cycle of an AM signal with 100% modulation where the signal frequency is fixed and the carrier is variable. The wavelet is a burst.
Hi,
I can only recommend books not from audio field 😀 This one the previous I read
Time-frequency and Wavelets in Biomedical Signal Processing by Metin Akay, 9780780311473 - Seekbooks
700++ pages of HC math. If you're into it, it's good read and versatile in it's field of focus.
- Elias
I can only recommend books not from audio field 😀 This one the previous I read
Time-frequency and Wavelets in Biomedical Signal Processing by Metin Akay, 9780780311473 - Seekbooks
700++ pages of HC math. If you're into it, it's good read and versatile in it's field of focus.
- Elias
Can someone recommend a good book to look at?
Hi,
This is true, there is not much in audio. However, in other science fields the situation is very different.
Many things can be analysed in conventional methods too. One can say wavelets come to the rescue when all the other methods have showed no results one is looking for 😀
Wavelets can visualise multible of phenoma in one plot. That's why it's powerfull. Signals like audio have time-frequency space, so wavelets fit in perfectly.
Also, now that the computing power is of no issue at home, wavelets will come and take over. Surely! 😀
- Elias
There is not too much material out there about wavelet analysis considering the technique isn't any new. Most you will find related to picture processing but way less to professional audio processing.
This is true, there is not much in audio. However, in other science fields the situation is very different.
Many things can be analysed in conventional methods too. One can say wavelets come to the rescue when all the other methods have showed no results one is looking for 😀
Wavelets can visualise multible of phenoma in one plot. That's why it's powerfull. Signals like audio have time-frequency space, so wavelets fit in perfectly.
Also, now that the computing power is of no issue at home, wavelets will come and take over. Surely! 😀
- Elias
- Status
- Not open for further replies.
- Home
- Loudspeakers
- Multi-Way
- WTF!? Wavelet TransForm for audio measurements - What-is? and How-to?