Make sure to select the right sampling frequency. The sound chip
on my mainboard measures reasonably only on 48 kHz and higher.
If there is a DAC to ADC FR compensation, use it. It would EQ
any FR aberrations of the sound card.
on my mainboard measures reasonably only on 48 kHz and higher.
If there is a DAC to ADC FR compensation, use it. It would EQ
any FR aberrations of the sound card.
"White Bar" - I don't follow you.
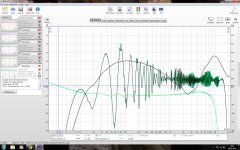
Do you see the white rectangles at the top I each panel on the left? It says "soundcard" and "Oct 26 14:51:22" - type in that box what the curve represents and it shows up on the legend box below plot. I see your mic cal is the black curve. That is fine as correction is of order 1.5dB in HF. Show plot vertical axis from 50dB to 100dB when you have data and the waviness of a 1.5dB correction is nothing. With speakers you should be happy to get response that is flat within +/- 3dB.
I think it looks like the input and output signals bled together a bit when trying to make the soundcard cal. Also, maybe the end of a meandering thread about speaker kits is not the best place to learn how to set up measurement gear? You are allowed to make your own threads, you know 😉.
Last edited:
I think it looks like the input and output signals bled together a bit when trying to make the soundcard cal. Also, maybe the end of a meandering thread about speaker kits is not the best place to learn how to set up measurement gear? You are allowed to make your own threads, you know 😉.
This is my thread.
We are at the stage of trying to figure out what is wrong with the Prestige Platinums.
So it is, my mistake. If you can't get the calibration to work, you could just skip it and assume you may have a little error at the far ends of the spectrum. I would say skipping it is definitely preferable to using the noise shown above as calibration.
I'm going to try the calibration technique. The speakers and the amps are just so enormously heavy that it's going to take a bit of time before I can get around to it.
My MiniDSP Umik 1 has arrived
Apart from the UMM-6, I have also ordered a UMIK-1 from MiniDSP. It arrived today.
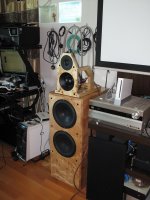
I have measured the VM752 raw driver.i.e. the amp is connected to VM752 without any crossover. (the driver is mounted on the cabinet frame - see attached)
First the UMIK-1 does not have dynamic range to measure above 91-92db. Thus meausreing at 2.83V is not possible as the VM752 can peak 95db at 1 watt.
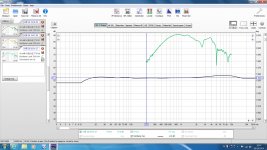
The attached file is the log sweep graph of the VM752 from 200-10,000Hz. The VM752 is mounted. This graph has been 'gated' about 3.5milli seconds to remove the reflection from the ceiling or side walls. (This technique is described in the MiniDSP website).
When I compare the freq response, this graph is similar to the one published by Volt on their website.
I am actually concern with the freq 'dip' at around 2.5K Hz. As I am crossing the VM752 at about 4.5K on the upper end. This dip is actually showing up on my overall freq response of the speaker.
I have no idea how this dip is translated to my listening experience. But it is not doing good to my nerve. I would expect an expensive driver like this to produce something flatter.
This hobby is geting interesting but it is getting more and more difficult for me to understand the academic knowledge behind all these.
Rdgs.
Apart from the UMM-6, I have also ordered a UMIK-1 from MiniDSP. It arrived today.
I have measured the VM752 raw driver.i.e. the amp is connected to VM752 without any crossover. (the driver is mounted on the cabinet frame - see attached)
First the UMIK-1 does not have dynamic range to measure above 91-92db. Thus meausreing at 2.83V is not possible as the VM752 can peak 95db at 1 watt.
The attached file is the log sweep graph of the VM752 from 200-10,000Hz. The VM752 is mounted. This graph has been 'gated' about 3.5milli seconds to remove the reflection from the ceiling or side walls. (This technique is described in the MiniDSP website).
When I compare the freq response, this graph is similar to the one published by Volt on their website.
I am actually concern with the freq 'dip' at around 2.5K Hz. As I am crossing the VM752 at about 4.5K on the upper end. This dip is actually showing up on my overall freq response of the speaker.
I have no idea how this dip is translated to my listening experience. But it is not doing good to my nerve. I would expect an expensive driver like this to produce something flatter.
This hobby is geting interesting but it is getting more and more difficult for me to understand the academic knowledge behind all these.
Rdgs.
Attachments
Last edited:
Alan, the upper spl limit of the UMIK-1 is >130dB min. I have two and have tested them against manufactures specs. They match. I have never seen such a low spl limit imposed outside of a smartphone. My old Galaxy S2 was limited to 98dB, but that is because of the dsp processing for best speech production while minimizing backgound noise.
Also in regards to the dip at 2.5k is due to the phase shift vs frequency at the crossover point. This is a decent read to help you along this path. Please don't blame the drivers. 🙂
Not here, that's the raw (in cabinet) driver measurement, and here is the mfg. spec showing similar (but not identical) response, maybe because of early reflections in the measurement, or maybe the baffle, or maybe the measurement axis, or maybe they just vary a bit:Also in regards to the dip at 2.5k is due to the phase shift vs frequency at the crossover point.

Last edited:
Not here, that's the raw (in cabinet) driver measurement, and here is the mfg. spec showing similar (but not identical) response, maybe because of early reflections in the measurement, or maybe the baffle, or maybe the measurement axis, or maybe they just vary a bit:
I'd be wondering the same. Perhaps this is the mechanical filter equivalent. The point where the cone is decoupled from the vc vs vc/cap? Would want to see high res polars and distortion vs freq.
The dip is -5dB at 2.5khz in both plots. Seems consistent - you can make it look more attractive by plotting on larger scale to de-emphasize the size of the dip. Beer goggles. 🙂
Dumptruck, do you have a picture of it mounted? The short horn loading could be the result of this dip in that it is similar to a 7" driver.
- Status
- Not open for further replies.
- Home
- Loudspeakers
- Multi-Way
- Wilmslow Audio - Prestige platinum