Thanks Jan . So they are planning to also produce it in a SMD ? Production must be a big problem since this is 4 years old sheet. Thank you for what info they allow you to give us.Linear Systems has authorised me to post the preliminary data sheet for the '74B.
jan
Just arrived:
LSJ74:
2SJ74BL
LSJ74:
An externally hosted image should be here but it was not working when we last tested it.
2SJ74BL
An externally hosted image should be here but it was not working when we last tested it.
Here's a bogus J74:
An externally hosted image should be here but it was not working when we last tested it.
Thanks for the display . I am having trouble following with the much different scale of the bogus one.
What are we supposed to be looking for here?
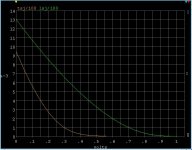
The X-axis is Vds 0 to 20V, the Y-Axis 0 - 10mA for the 2SJ74 and LSJ74, 0-20 for the fake. Each trace is separated by 100mV for the former 2, 500mV for the fake.
Maybe the fake is a re-marked J175 or J176. I think they have the same pinout as the 2SJ74. The transconductance would be about right. The old paint - marked parts would be easy to clean off and reuse.
Thanks for the clarification . So the bogus parts have curves that are off by a factor of 5 or so ?The X-axis is Vds 0 to 20V, the Y-Axis 0 - 10mA for the 2SJ74 and LSJ74, 0-20 for the fake. Each trace is separated by 100mV for the former 2, 500mV for the fake.
The X-axis is Vds 0 to 20V, the Y-Axis 0 - 10mA for the 2SJ74 and LSJ74, 0-20 for the fake. Each trace is separated by 100mV for the former 2, 500mV for the fake.
Thanks for posting this. Please help me out. As I understand you, the 2SJ74 and the LSJ74 curves differ by Vgs of 100 mV between each curve, is this correct? And the fake J74 curves differ in Vgs by 500 mV between each curve? Thus, the fakes require a much larger Vgs in order to obtain the same drain current? Which means, of course, a much lower transconductance in the fakes?
Steve
Jack, can you get a shot of the bogus part on the same scale as the others ?
Would have to go the other way around -- the steps are too close to zero, and the Idss of the J175 is probably 16mA
Whoops!
Sorry.Got over excited seeing the news.
and sorry for going offtopic again.
Getting excited is good, shows you're alive 😉
jan
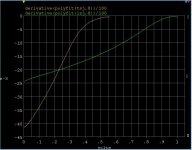
More grist for the mill. This is a comparison of the LSJ74 and 2SJ74 for conformance to ideal square law behavior (the derivative of Id vs Vgs should be a straight line, gm).
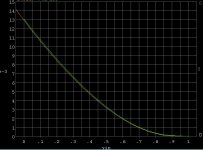
This is a sample of LSJ74C date code 8/27 (upper curve). The lower is a 2SJ74 BL both ploted as Id vs Vgs, Idss at the crossing of the left axis. The straight derivative of this raw data is very noisy so I did an 8th order polynomial fit and ploted that in the second figure (gm vs Vgs). Near pinch-off there are sub-threshold effects just like in MOSFETS that do not conform the the standard model. Otherwise give or take a little the lines are reasonably straight. The LSK part mainly comes up short on transconductance, but there is some deviation at moderately low current above the sub-threshold behavior.
To get a good estimate on the beta parameter and Vp. I would toss the data near pinch off and fit the equations.
EDIT - the 1/100 is from my 100 Ohm current sense resistor.
EDIT2 - In looking more closely there are some real issues, the gm at 1mA on both devices is comparable but at higher currents it is not almost as if there is excessive internal parasitic resistance in the LSK part.
Attachments
Last edited:
Scott,
If you have the coefficient of the polynomial, you can almost treat them as Yfs (1st), 2nd, 3rd, 4th order "harminics", right ?
We did similar and found 3rd order coefficient of the LSJ to be much higher than 2SJ.
But IMHO it will be a fairer comparison if the parts have the same Idss, and you "normalise" all the higher order coefficients to Yfs.
Patrick
Scott,
If you have the coefficient of the polynomial, you can almost treat them as Yfs (1st), 2nd, 3rd, 4th order "harminics", right ?
We did similar and found 3rd order coefficient of the LSJ to be much higher than 2SJ.
But IMHO it will be a fairer comparison if the parts have the same Idss, and you "normalise" all the higher order coefficients to Yfs.
Patrick
Yes in general you can substitute the polynomial expansion into your circuit equations and use the trig identities to extract the harmonics, if you want to do it by hand.
I'm working on a model fit using my parasitic resistance assumption. One problem with just normalizing is that it is not a multidimentional approach and the underlying process differences usually have a complex interaction.
I'm sure I have enough parts to find one of eash within a few percent of Idss to confirm any assumptions. If there are significant extrinsic resistances it opens up the possibility that the FET is not exactly reversible, an experiment I can do today.
Last edited:
Why assume the function that fits the data best, will have integer exponents?
Instead of using the nine fitted parameters P0, P1, P2, ... , P8 to find a best-match between measurements and the equation
 ,
,
why not use these other nine fitted parameters K0, K1, K2, ... , K8 to find the best match between measured data and this other equation
 ?
?
All it requires is a nonlinear optimizer that handles inequality constraints. (since you'd want to install the constraints K2 < K4 < K6 < K8)
Who says the first equation fits the data better than the second?
Instead of using the nine fitted parameters P0, P1, P2, ... , P8 to find a best-match between measurements and the equation
why not use these other nine fitted parameters K0, K1, K2, ... , K8 to find the best match between measured data and this other equation
All it requires is a nonlinear optimizer that handles inequality constraints. (since you'd want to install the constraints K2 < K4 < K6 < K8)
Who says the first equation fits the data better than the second?
Who says the first equation fits the data better than the second?
The first lends itself to algebraic extraction of a harmonic series the second does not. Fitting the data is not the only desired end but a set of parameters that plug into the standard model. Maybe the exponent in the basic FET equation is fit better if it is 2.05 rather than 2 but there is no model parameter for this.
This is DIY not DARPA, 99% of the folks here use LTSPICE or some equivalent and the Level 1 model.
Ah, I thought your purpose in using the fitted equation was to smooth out the measured data so the numerical derivative (gm) would also be smooth

If you post or PM me the noisy (Vgs, Ids) dataset, I'd be happy to fit a few different functions to it, including the two in post #177, and take numerical derivatives of each. It might also be fun to horse around with Savitzky-Golay FIR filters too, since SG's original (1964) design goal was extraction of numerical derivatives from noisy data.
As you allude in post #176, extracting the harmonics "by hand" is one way to skin the cat, but not the only one.
Ah, I thought your purpose in using the fitted equation was to smooth out the measured data so the numerical derivative (gm) would also be smooth
If you post or PM me the noisy (Vgs, Ids) dataset, I'd be happy to fit a few different functions to it, including the two in post #177, and take numerical derivatives of each.
Well actually the little Analog Discovery box has no averaging feature that I can find so that was a quick fix. A running average smoothing would probably be enough since there are way more datapoints than needed. The data file is only 13k so I will attach it (Vgs,Id comma delimited with lots of pointless resolution).
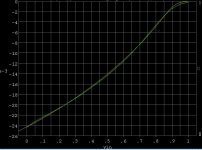
Here's a quick fit using an extrinsic Rsource of 11.2 Ohms, Idss = 16.5mA, Vt =.92V. Starts looking pretty good most of the higher order fitting tries to make the subthreshold region fit. I mis-spoke there is provision for subthreshold in the level 1 model just almost no one uses anymore than the default values.
I think the main point here is that by just measuring Idss you grossly under estimate the actual model parameter. The Toshiba 2SJ74 fits with a much smaller Rsource.
EDIT Don't forget Id = V/100
Attachments
Last edited:
- Status
- Not open for further replies.
- Home
- Amplifiers
- Pass Labs
- Will linear deliver on promised lsj74