Okay yeah I’m suprised you don’t remember, was the best thing I did for my sub
So okay yeah that makes sense
So the 2nd part of my question, weather it’s an added subsonic filter or a natural low end rolloff , I’m gathering that sub high pass would act like a minimum phase filter of sorts , so a cascaded filter in the midbass crossover could* possibly benefit if one could match its Q and shape and add it to the midbass , even tho it’s out of band, I suspect there’s enough phase down that low to still affect the system….. I mean , I know with rephase we don’t necessarily need to run to minimum phase crossovers like we would be chained to in other dsps , but , let’s say in the instance im tuning a minimum phase dsp…
Like in those dsps , I pretty much always cascade the midbass HPF on to the mid and tweet , and if dsp has no cascade an AP2Q.7 does the trick also
So im suggesting maybe add the cascade to midbass also from the sub natural HP….. see any benefits?
Thanks !
It's possible that there might be a benefit, try it and see.
https://www.diyaudio.com/community/...ssovers-a-la-linkwitz-multi-cascading.332562/
https://www.diyaudio.com/community/...ssovers-a-la-linkwitz-multi-cascading.332562/

Thank you , that was a fun read… yes exactly what I was thinkin…. Very cool 😎
I’m excited to try it….my ginny pig is next week I have an install scheduled with a helix dsp…. I’ll try it on that 🙂
I’m excited to try it….my ginny pig is next week I have an install scheduled with a helix dsp…. I’ll try it on that 🙂
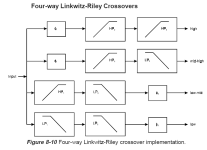

Interesting, so your cascade is for a 4th order complimentary?
I always use a LR2 on HF, mid, and midbass LP (polarity flip on mid)
Then a LR4 on sub LP and midbass HP
Then that midbas LR4 as a cascade on mid and HF
Yours is a little different…… interesting
I always use a LR2 on HF, mid, and midbass LP (polarity flip on mid)
Then a LR4 on sub LP and midbass HP
Then that midbas LR4 as a cascade on mid and HF
Yours is a little different…… interesting
Looking at the top two plots, I would imagine that there would be an audible difference. WIth the exception of the modal region I would imagine the response that generated the lower plot would sound deader, with more precise imaging. But that becomes a matter of degree and personal preference, and obviously I couldn't judge w/o actually listening. .Some like pin point imaging. Some like a more open, natural sound.
Happy Easter to all.
I think I misspoke here when I said "deader". more accurate description would probably to say it pushes the system more towards anechoic sounding. And it still depends on how the impulse response is processed. For example, looking at these wavelet plots which would sound better?
I think we would all be temped to say the left plot looks better but in reality this is the same speaker measured at the same position with no changes. In fact, both plots were generated from the same impulse. The only difference is how the impulse was windowed.
Complimentary, but not necessarily 4th-order. Every filter that has the same subscript is of the same order (except the allpass filters, of course, which are of order/2).Interesting, so your cascade is for a 4th order complimentary?
I can assure you that the two top plots I posted both used the exact same settings, they were taken just minutes apart 😉. Even the other ones were done with the exact same settings.I think we would all be temped to say the left plot looks better but in reality this is the same speaker measured at the same position with no changes. In fact, both plots were generated from the same impulse. The only difference is how the impulse was windowed.
Those plots are normalised and fixed, so I couldn't have played with the top SPL level like you just did, 92 on the left graph and 82 on the right 😀.
The APL_TDA software I used presents the wavelet in a "standard" non controllable way.
The thing to notice in your plot are the parallel lines beside the arrival of direct sound. Reflections?
I'm curious about the time scale on the right...
Wasn't implying that they weren't the same. But check the levels. they both go from from 92 to 20. 😱I can assure you that the two top plots I posted both used the exact same settings, they were taken just minutes apart 😉. Even the other ones were done with the exact same settings.
Yes, Windowing... duh... The windowing cuts off the rest of the stuff, should have read a little better 🙂.
But that's not what we were on about, was it? We do use a form of windowing to get the information we want to use, but we don't use windowing to make our plots look better 😀.
But that's not what we were on about, was it? We do use a form of windowing to get the information we want to use, but we don't use windowing to make our plots look better 😀.
A simple method if your LMS allows is to add a global high pass filter on the inputs, it would then affect all the bands equally and therefore you could adjust the high pass filter at will, without having to re align multiple bands.So the 2nd part of my question,
Yes, Windowing... duh... The windowing cuts off the rest of the stuff, should have read a little better 🙂.
But that's not what we were on about, was it? We do use a form of windowing to get the information we want to use, but we don't use windowing to make our plots look better 😀.
Unless you are a speaker manufacturer. 🤣
Hi krivium, very nice post, thank you.I must conceed my own pre conception were the same as yours Mark when you started this thread. I think there have been enough evidence and explanation prooving it was misconception and not this well understood principle of application.
Wesayso, Fluid, Mitchba you are onto something imho. And i find amazing it happened with 'free' tools and from 'amateurs' ( given it's a hobby... you are more 'experts' imv).
Thank you all for made me reconsider all this and change POV.
Sorry for the slow reply. I've had the joy to go on a trip to go see my first grandchild, a healthy happy baby girl on her second day of life.!!!!
'bout time for this 70 year old geezer to get a grandkid, bless my beautiful daughter (who's doing quite well too)
Anyway, I defintely have a lot of old school thinking in me, not the least of which is the separation of cause and effect, from correlation.
Frankly, I know i still have a lot to learn about just measurements themselves, before I'm ready to tackle in-room measurements, to that end.
As I'm about to post to John K, think I'm going to hit the ARTA manual pretty hard....the chapter impulse analysis, particularly on Burst Decay, appears quite relevant to FDW.
Hi John K..., seeing this post reminded me of things I've seen in the ARTA manual. Do you use ARTA?I was thinking about these FDWs and trying to get a better understanding of what they represent. I don't know if this has been discussed before, so here are my thoughts. I thought of RT60 and CSD plots (water falls) and how the decay time vary with frequency, . Typically the higher the frequency the shorter the decay time is. You can generate a 3-D plot (CDS) of the decay of a signal, Amplitude vs time as a function of frequency, as pictured crudely below. High frequency to low, front to back. Then if you cut a horizontal plane through that curve at a given amplitude you get a time vs frequency for the the signal to decay to that level. In a sense, would not each of these horizontal curves represents a FDW where you would be windowing out any contribution to the impulse where the level of the contribution at that frequency dropped below a certain dB level? Thus, in essence, using a FDW seems like imposing a decay curve for the room. So, when you choose a FDW for a measurement, the resulting response is perhaps similar to that of an un-windowed response of a room with a similar decay vs frequency, at the measurement position.
View attachment 1162669
It has a very good chapter on impulse analysis, and goes on about the differences in Burst decay, CSD, FDW ,and windowing techniques in general.
And how they change measurements. I realize how much of it i still don't understand, so I'm going to hit the books a little....
Truly hoping to find compelling logic to dive deeper into room-correction DSP...
but until then, I know old school, much in line with your posts, works pretty dang awesomely well. 🙂
Thanks krivium and Subsonics. Good luck to both you guys getting some grandkids 😀
Krivium...maybe you have more room for hope than you fear. My 32 year old daughter, who just gave birth, was born when i was 38yo (like you with your first son)
You just gotta get old like me haha
But hey, I'm still hanging in Ok i think,..... here's me hangin on a ski rope on 70th bday last summer

Krivium...maybe you have more room for hope than you fear. My 32 year old daughter, who just gave birth, was born when i was 38yo (like you with your first son)
You just gotta get old like me haha
But hey, I'm still hanging in Ok i think,..... here's me hangin on a ski rope on 70th bday last summer
I had ARTA, HOLMImpulse, but pretty much I use Sound Easy and the good, old IMP. All these things like CSD, Wavelet, Spectograms, burst response, are nice to look at but ultimately they are all just impulse processing. Soundeasy can generate them all but the graphfics are as sufisticated as some of the other software. What I have been trying to do is to look at a response generated with FDWs and then develope minimum phase EQ and then phase correcting to make the FDW response flat with linear phase,. Then apply that to the actual speakers in room response (single long FFt window) and compare the impulse for the 3 configurations. I've run into some software limitations but a crude approximation to doing that yields something like this.Hi John K..., seeing this post reminded me of things I've seen in the ARTA manual. Do you use ARTA?
It has a very good chapter on impulse analysis, and goes on about the differences in Burst decay, CSD, FDW ,and windowing techniques in general.
And how they change measurements. I realize how much of it i still don't understand, so I'm going to hit the books a little....
Truly hoping to find compelling logic to dive deeper into room-correction DSP...
but until then, I know old school, much in line with your posts, works pretty dang awesomely well. 🙂
Applying the eq and phase correction to the FDW response results in this. Black is the raw (approximate) FDW response impulse, Red is after EQ and phase correction, i.e. perfectly flat, linear phase. (I say approcimate FDW because while I can generate an FDW response I can't seem to export it into a driver file. So I did a cut and paste using different window lengths for different frequency ranges, 200-400, 400-800, 800-1600, etc.)
Applying the same EQ and phase correction to the "real" speaker response yields this. The added blue curve is the intermediate of just applying the minimum phase EQ. Note that up to about 4msecthe real and FDW responses are pretty much the same because the minimum window length in the FDW case was 4 msec.
Anyway, weather is going to be in the 70s and 80s this week so I'm getting off the couch and getting out side and play with my 🚗 🚕. 🙂
Just use the FDW function of the free DRC_FIR tool👍.
You can export the windows it generates to file for use in more familiar tools.
1) I thought that is for generating the fir filters. I have no problem there. SoundEasy does that if I want to,and applies them. But I'm just doing simulations. I just can't save the starting point FDW frequency of the speaker.
Here is the FDW response with the "real" room response below. I wanted to EQ and phase correct the FDW and apply those corrections to the "real" response and look at the impulse. Since I can save the FDW I generated an approximation and used that for the FDW.
- Home
- Loudspeakers
- Multi-Way
- Why not IIR filters + a global phase linearization by FIR