That's what I like about this forum. No beating around the bush, sitting on the fence, contentious grandstanding and/or misdirection... "Just the Facts, mam... Just the Facts..."
John L.
John L.
Two 90x40 horns arrayed at +/- 45 degrees relative to on-axis might do it.Is it even physically possible to achieve 180 degrees horizontal 40 degrees vertical CD at the same time ? (Non CD, at some spot frequency, yes)
I'm wondering what matters more: power response or smooth/constant off-axis response. Power response will drop for bass (especially when using a sub) and will go up for BSC... but does it matter?One way to look at it is to consider the unit and its reflection. If the unit is 1/4 wavelength off the surface the 2 units are 1/2 wave apart and a null would happen in the upwards direction. For wavelengths longer than that the unit and its reflection would be in phase in all directions. At that point (and for frequencies lower) the units are essentially joined and the unit must be in half space.
4 ft would give a 1/2 wave separation at 69 Hz. For frequencies below that the unit is essentially in half space. Of course the room's standing wave pattern will always apply and may overide the simple boundary effect.
Why are you asking?
David S.
That's what I like about this forum. No beating around the bush, sitting on the fence, contentious grandstanding and/or misdirection... "Just the Facts, mam... Just the Facts..."
John L.
That post is art 🙂
I was doing some measurements this morning and I figured why not try the in-phase/out-of-phase difference measurement. And well, here it is. However I don't remember how it was said it should be interpreted. A quick search through this topic didn't help me out either. Is there anyone who could give me a concise explanation?
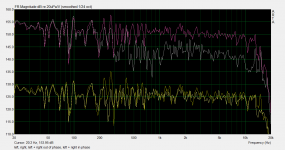
EDIT: I see that somehow the captions disappeared. The lower two curves are the individual left (darker yellow) and right (lighter yellow) speakers. The upper two curves are the in-phase measurement (purple) and the out-of-phase measurement (bluish grey).
EDIT2: And of course, the upper two curves are off-set by 20 dB!
Attachments
Last edited:
However I don't remember how it was said it should be interpreted. A quick search through this topic didn't help me out either. Is there anyone who could give me a concise explanation?
I suggested the test as a way to reveal the relative level between the direct response and the reverberent field at our listening positions. The thread had been concentrating purely on speaker directivity and ignoring listening distance and room effects, both equally integral to the issue.
Generally, the lower the curve after cancellation the greater the proportion of direct sound and the lesser the proportion of later room sound at your particular listening location.
Whats good? We know that there is a continuum from listening in a dry room with directional speakers, to having Bose 901s in a tile bathroom. At one exteme you will be close to a headphone experience, only hearing the direct sound of the recording, while at the other extreme the musicians have been pulled into your room to fully employ it's acoustics, for better or for worse. There is an element of taste here and some will like more room contribution than others.
From the curves we've seen so far the typical curve shows about 3 to 6 dB prominence of the direct plus reverberent field over the reverberent field. This means that most of us sit a little closer than the critical distance.
In the end we would need to combine the results of the measurements with each listeners assesment of whether their particular room effect is "too weak" or "too strong" to really come to any conclusion, but I'm glad that so many jumped on board and made the measurements (except Earl, of course).
Regards,
David S.
Obviously you have positioned your mike exactly on the stereo axis. What bothers me is the (apparent) convergence of both curves below 200 Hz. Normally both curves should diverge to lower frequencies. One needs to see the noise floor at those frequencies to decide, whether that convergence is simply the influence of the raising noise. From 200Hz -2kHz the (documented) imbalance between L and R is reflected in the convergence of the purple and grey curves.I was doing some measurements this morning and I figured why not try the in-phase/out-of-phase difference measurement. And well, here it is. However I don't remember how it was said it should be interpreted. A quick search through this topic didn't help me out either. Is there anyone who could give me a concise explanation?
EDIT: I see that somehow the captions disappeared. The lower two curves are the individual left (darker yellow) and right (lighter yellow) speakers. The upper two curves are the in-phase measurement (purple) and the out-of-phase measurement (bluish grey).
EDIT2: And of course, the upper two curves are off-set by 20 dB!
Rudolf
Last edited:
Thanks, David!
I think in theory a perfectly symmetrical setup would lead to no sound at all at the measurement mic, because reflections would cancel also.
Earl is very busy. He hasn't had the time to generate the directivity plots of my speakers with his software, although I emailed him the measurement data he asked for almost three months ago. We'll just have to be patient, I think.
Generally, the lower the curve after cancellation the greater the proportion of direct sound and the lesser the proportion of later room sound at your particular listening location.
I think in theory a perfectly symmetrical setup would lead to no sound at all at the measurement mic, because reflections would cancel also.
(...) I'm glad that so many jumped on board and made the measurements (except Earl, of course).
Earl is very busy. He hasn't had the time to generate the directivity plots of my speakers with his software, although I emailed him the measurement data he asked for almost three months ago. We'll just have to be patient, I think.
Rudolf, I'm sorry I forgot to mention that below about 180 hz the signal is mono. Forget about that part. Due to a problem with the miniDSP software I was unable to turn the bass off (although I could of course have simply turned off all subs).
I also got a similar result below 500Hz (separation colapsing) , except that I don't have any subs, and it was definitely stereo all the way down. http://www.diyaudio.com/forums/mult...y-pattern-stereo-speakers-62.html#post2761623
I put it down to room asymmetry...
Tony.
I put it down to room asymmetry...
Tony.
Finally.
The answer we've all been waiting for.
We can all go home.
You beat me to it. I read that comment and thought the same thing.
Exactly. I've extensively played with static 2-->3 rematrixing, simplest form is : C=L+R, L'=L-0.5R, R'=R-0.5L, and +45, 0, 45 deg angles, known as Trinaural.
...
- Klaus
Klaus !
Are you sure about the equation ? For C I think C = 0.5L + 0.5R ?
- Elias
^^
Elias, you're right, thanks for correcting that.
The more generic equation, as given by Michael Miles from MilesTech and coined "Optimum Linear Matrix", is :
L' = L - kR
R' = R - kL
C = (1-k)(L+R)
With k = 0.5 it's "Trinaual
- Klaus
Elias, you're right, thanks for correcting that.
The more generic equation, as given by Michael Miles from MilesTech and coined "Optimum Linear Matrix", is :
L' = L - kR
R' = R - kL
C = (1-k)(L+R)
With k = 0.5 it's "Trinaual
- Klaus
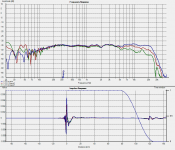
I made myself a new speaker testing stand today with swivel at the top to allow me to easily do off axis measurements. I've attached the results of 0 through 90 degrees off axis for my MTM, same ones that were used for the pink noise tests above, just to give some context I guess 🙂
First pic is all the measurements in 15 deg increments through 90 degrees. Note that there were a bunch of plants that the speaker would have been pointing directly at between 30 and about 75 deg, whether or not these affected the measurements I can't say because I was too lazy to move them 😉
I did fairly low spl level measurements as it was after 9:00pm
the second pic is the holm measurements for zero 15 and 30 showing the impulse response as well.
Tony.
Attachments

It look like the distance between speaker and mic is a bit larger at larger angles. Did you turn the speaker around it's baffle centre-axis, or at some axis more to the rear of the speaker?
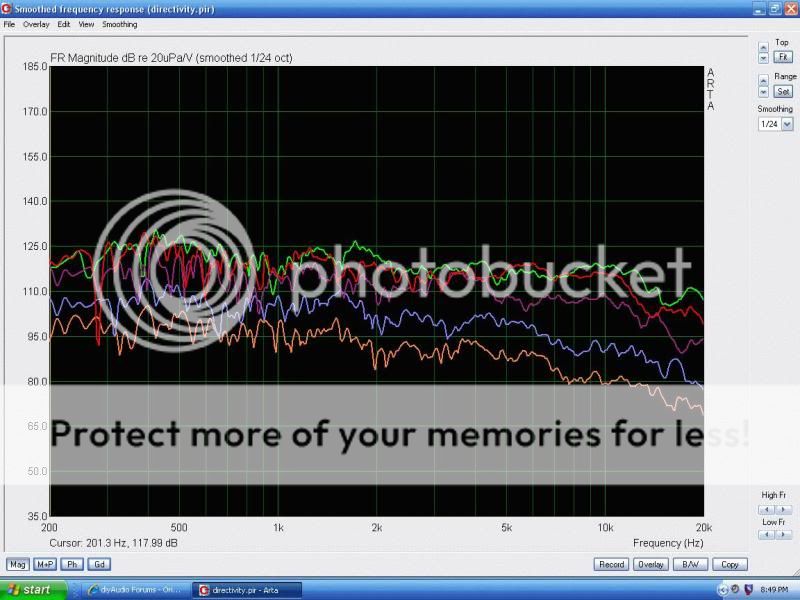
RD75 dipoles
Here's my 6' dipoles at 0, 15,30,45, & 60 (green,red,purple,blue,brown) offset in ARTA for ease of reading. I'll have to set up to do the in/out of phase measurements
smoothed 1/24 octave back in 2008
And here's an on-axis attempt to maximally flat (which sounded way too brite, btw, hence the subsequent designed-in tilt)
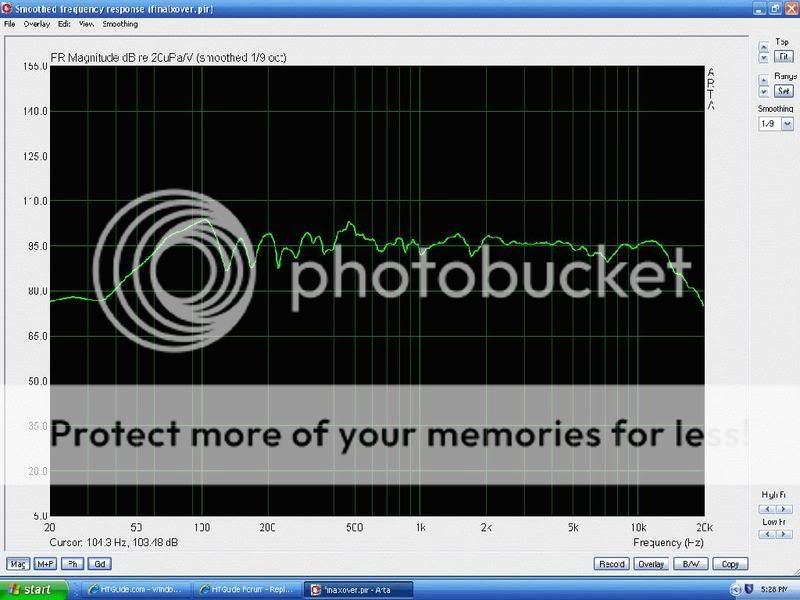
All measurements taken @ ~ 15 feet from speaker @ 3' height
John L.
Here's my 6' dipoles at 0, 15,30,45, & 60 (green,red,purple,blue,brown) offset in ARTA for ease of reading. I'll have to set up to do the in/out of phase measurements
smoothed 1/24 octave back in 2008
And here's an on-axis attempt to maximally flat (which sounded way too brite, btw, hence the subsequent designed-in tilt)
All measurements taken @ ~ 15 feet from speaker @ 3' height
John L.
Last edited:
It look like the distance between speaker and mic is a bit larger at larger angles. Did you turn the speaker around it's baffle centre-axis, or at some axis more to the rear of the speaker?
Yes the pivot point is not quite on the front baffle axis, it is about 1" behind it, which does introduce a little error. I could move the speaker back a little further but then I start to get diffraction effetcs off the platform.
edit: I guess you picked that up from the impulse response? I time zero locked it so that time of flight was absolute between the measurements 🙂
Tony.
Last edited:
1" of offset is not going to make any difference. I often have 3" or so and I don't see any effects from this. I also worried about diffraction from the platform, but I haven't found that to be much of a problem either.
See Tony's pivoting measurement stand here:
http://www.diyaudio.com/forums/equipment-tools/200198-low-cost-speaker-testing-stand.html
http://www.diyaudio.com/forums/equipment-tools/200198-low-cost-speaker-testing-stand.html
- Status
- Not open for further replies.
- Home
- Loudspeakers
- Multi-Way
- What is the ideal directivity pattern for stereo speakers?