VituixCAD itself is a Loudspeaker Xover simulation software that can use measured data from number of other software that are meant for the actual measurement of Impedance/Frequency response. So if you want to look for info on measurements you'd look for "measurement / soundcard for ARTA or REW or HOLM Impulse or Soundeasy" etc. Those are for measurement and would give a result. Most of these are for Windows only, but Room EQ Wizard has a Linux download so I assume it'll work.
Focusrite Scarlett 2i2 should be quite ok. The simplest loopback is a TRS-TRS cable (6.5mm ->6.5mm plug) from OUT2 to IN2... and the OUT1 would feed your measurement amp and IN1 you'll use for a 48V phantom powered measurement mic.
Among other more expensive gear I'm using Focusrite iTrack Solo and that works ok too. 2i2 would be a bit simpler to gear up for impedance measurements.
Kimmo also has a tutorial for REW here
alignment B6
Is possible create a project with alignment 6th order butterworth (active and passive) ?
Is possible create a project with alignment 6th order butterworth (active and passive) ?
kimmosto
Big thanks for a hard work. Great software.
rikiheck
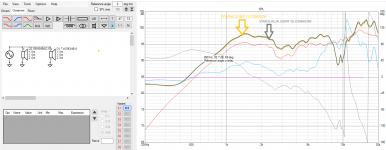
You can make measurements with most of the sound cards on the market. Important is to check if the latency is constant. The only thing to do is to check if the measured sum of the drivers matches simulated sum of the drivers. My advice is to try to do some measurement with any sound card (some integrated in laptop are fine too). Let me say You will try to do 2 way monitor, please prepare three measurements:
-Tweeter
-Midwoofer
-Sum of the drivers
First task is to make simulated (gray on pic bellow) sum of the drivers look exacly the same with measured (yellow on pic bellow) sum of the drivers. In case of floating latency of the sound card You can cheat it a bit with Z-axis to get rigt results.
Regards
Big thanks for a hard work. Great software.
rikiheck
You can make measurements with most of the sound cards on the market. Important is to check if the latency is constant. The only thing to do is to check if the measured sum of the drivers matches simulated sum of the drivers. My advice is to try to do some measurement with any sound card (some integrated in laptop are fine too). Let me say You will try to do 2 way monitor, please prepare three measurements:
-Tweeter
-Midwoofer
-Sum of the drivers
First task is to make simulated (gray on pic bellow) sum of the drivers look exacly the same with measured (yellow on pic bellow) sum of the drivers. In case of floating latency of the sound card You can cheat it a bit with Z-axis to get rigt results.
Regards
Attachments
Is possible create a project with alignment 6th order butterworth (active and passive) ?
Yes, butterworth up to 8th order in active filter.
Passive filter is dependent upon how many capacitor and inductor elements in the crossover.
Read more at kimmosto's website - VituixCAD
Yes, butterworth up to 8th order in active filter.
Passive filter is dependent upon how many capacitor and inductor elements in the crossover.
Read more at kimmosto's website - VituixCAD
ok for the crossover filters, but for the box design?
I think bb4 is different from the B6 as from the tables
but for the box design?
6th order is called as "Bandpass type 3" in Enclosure tool:
An externally hosted image should be here but it was not working when we last tested it.
Quasi 6th order is "Band pass type 2":
An externally hosted image should be here but it was not working when we last tested it.
Important is to check if the latency is constant. The only thing to do is to check if the measured sum of the drivers matches simulated sum of the drivers. My advice is to try to do some measurement with any sound card (some integrated in laptop are fine too). Let me say You will try to do 2 way monitor, please prepare three measurements:
-Tweeter
-Midwoofer
-Sum of the drivers
First task is to make simulated (gray on pic bellow) sum of the drivers look exacly the same with measured (yellow on pic bellow) sum of the drivers. In case of floating latency of the sound card You can cheat it a bit with Z-axis to get rigt results.
This is not according instructions. Programs such as REW and ARTA normalize timing in single channel mode i.e. impulse peak is moved to 0 ms so constant latency and non-constant latency produce the same result which is not valid for design style VituixCAD is designed for.
6th order is called as "Bandpass type 3" in Enclosure tool:
An externally hosted image should be here but it was not working when we last tested it.
Quasi 6th order is "Band pass type 2":
An externally hosted image should be here but it was not working when we last tested it.
I meant the type B6 n° 15 (6 order first class) upload with reference to page 187 of the attached file.View attachment thieles_vented_box_article_1_OCR.pdf
Last edited:
^Ok. Combinations of vented radiator and filter are not in alignment tables in Enclosure tool, but Optimizer or Export driver's TF features allow designing of (almost) any target response with active filter to (almost) any vented alignment. Alignment tables were handy 40-50 years ago, but not mandatory anymore.
Last edited:
Rev 2.0.50.2 (2020-05-12)
Main
* Added source voltage Ug and output impedance Rg parameters to Generator. Default values are 2.83 V and 1 mOhms. Voltage affects to sound pressure level in SPL, Power&DI and Directivity graphs, but not to Power dissipation window having own signal. Level in SPL plots equals to USPL when frequency responses in Drivers tab are scaled to dBSPL/2.83V and Ug=2.83V.
2.0.50.1 (2020-05-07)
Main
* Added Check updates checkbox to Options window. Allowes disabling automatic updates if firewall blocks downloads by default or working without continuous network connection.
Main
* Added source voltage Ug and output impedance Rg parameters to Generator. Default values are 2.83 V and 1 mOhms. Voltage affects to sound pressure level in SPL, Power&DI and Directivity graphs, but not to Power dissipation window having own signal. Level in SPL plots equals to USPL when frequency responses in Drivers tab are scaled to dBSPL/2.83V and Ug=2.83V.
2.0.50.1 (2020-05-07)
Main
* Added Check updates checkbox to Options window. Allowes disabling automatic updates if firewall blocks downloads by default or working without continuous network connection.
Hi Kimmosto;
Amazing software; very well done. Congratulations. I have a question about the optimizer; can it optimize to a target response using biquad coefficients as the optimization variables?
Thanks again
Matt
Amazing software; very well done. Congratulations. I have a question about the optimizer; can it optimize to a target response using biquad coefficients as the optimization variables?
Thanks again
Matt
can it optimize to a target response using biquad coefficients as the optimization variables?
It's technically possible, but optimizer algorithm (amoeba) is too aggressive for biquads and initial min-max limits of coefficients are too wide (though user can limit more). Optimizing one biquad at a time could work but it's recommended to design filters with generic active blocks and then copy blocks to coefficients if gear/app is compatible with miniDSP biquad format.
More in post #1464 in September 2019.
Hi Kimmosto
In one of my array sims, I set the mic offset to +500mm and I noticed the vertical axis of symmetry (horizontal line around which polar map is symmetric) moved down to negative vertical angle. Is the same direction or opposite direction? In other words, is a positive angle on the vertical polar map up or down?
Thanks,
Jack
I applaud this change wholeheartedly!
Voltage adjustment is just cheap trick; multiplying simulated SPL responses with Ug divided by 2.83 V. Network calculation is still using the same old universal 1 Vrms as before. Main advantages are that user could set some small line level signal if active system has buffers i.e. power amplifiers with known gain 25...30 dB, and crossover variants e.g. active and passive can have totally different signal levels.
Main change is adjustable Rg which enables for example simulation of current driving and adding resistance of long speaker cables. Also active buffers would need adjustable Rg because they play power amps in the simulation, but it's not done yet.
In other words, is a positive angle on the vertical polar map up or down?
Positive Y mm is up and positive vertical angle is up = upper part in polar map. At least should be 🙂
It's technically possible, but optimizer algorithm (amoeba) is too aggressive for biquads and initial min-max limits of coefficients are too wide (though user can limit more). Optimizing one biquad at a time could work but it's recommended to design filters with generic active blocks and then copy blocks to coefficients if gear/app is compatible with miniDSP biquad format.
More in post #1464 in September 2019.
Thanks Kimmosto;
I hadn't noticed the 2nd order blocks with Q; that would be the place I could start and bounding the variables is definitely what I had in mind for this.
Thanks again
Matt
Positive Y mm is up and positive vertical angle is up = upper part in polar map. At least should be 🙂
That is what I expected and makes perfect/intuitive sense but it leaves me at a loss to explain the change in the vertical polar map - when I move the mic up the horizontal centerline of the vertical polar map main beam moves down?
That it changes at all is somewhat surprising. Intuitively, the polar map is what it is and one should be able to move the mic around within it to see the response at various points defined by their x,y,z in the mic offset boxes. That it changes at all implies something about the polar map or how it is calculated that I don't understand. Could you explain?
Thanks,
Jack
That is what I expected and makes perfect/intuitive sense but it leaves me at a loss to explain the change in the vertical polar map - when I move the mic up the horizontal centerline...
The reason for change in polar map is that origin of the speaker i.e. listening axis changes when microphone offset is adjusted. It's usually very difficult and slow to adjust location of all driver instances in crossover to simulate just small X,Y changes in listening point. Much easiest is to change position of virtual mic/ear which kinda moves whole construction up-down and left-right from listener's point of view.
So main beam of the speaker (usually) shoots below mic/ear i.e. to negative vertical angle when mic/ear is moved up, and so on.
Keeping polar map unchanged while adjusting mic offset would require different calculation for polar map end everything else, and some horizontal line/ruler to show mic/ear position in chart. More work and probably reduced performance. Maybe more intuitive, but not in my opinion 🙂
Last edited:
- Home
- Design & Build
- Software Tools
- VituixCAD