Can you change in the program the hfe scale, for example to 350 - 450?Real devices don't always perform as the datasheet predicts.
_
Yes Locky Z's tracer makes that super easy -- because it's a software input, and software is quite flexible. Either before, or after, running a trace on the Locky Z, you can move your mouse to the plot window and click the Y-axis (or the X-axis). Then his software pops up a dialog window that lets you specify an Axis-min and Axis-max of your own choosing.
For the plot attached to post #118 of this thread, I clicked the X axis and chose (min=0, max=120mA) then I clicked the Y axis and chose (min=200, max=450). The transistor's datasheet predicted that Beta would swing between 70 and 220, but the physical transistor itself had a Beta which stayed in the narrower range (350 < Beta < 410).
For the plot attached to post #118 of this thread, I clicked the X axis and chose (min=0, max=120mA) then I clicked the Y axis and chose (min=200, max=450). The transistor's datasheet predicted that Beta would swing between 70 and 220, but the physical transistor itself had a Beta which stayed in the narrower range (350 < Beta < 410).
That clearifies all. The betatracer should cope with currents >> 600mA, up to 1A to make the descending slope visible.Look at the datasheet.
Add a variable emitter degeneration to the circuit ?
The MPS transistor with and without emitter degeneration:
Looks like it linearizes the left side of the mountain top only, the right side even suffers a bit.
Typo in the pictures 😵


The MPS transistor with and without emitter degeneration:
Looks like it linearizes the left side of the mountain top only, the right side even suffers a bit.
Typo in the pictures 😵
Last edited:
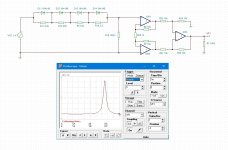
A simple logarithmic generator.
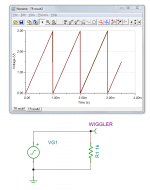
The 'generator for the generator' is a linear triangle generator, 2.8Vpp & +1.4Vdc offset, to drive the four diode-res segments.
I choose the resistor values to suit various currents through the diodes: 0.01mA, 0.1mA, 1.0mA and 10mA.
A generic instrumentation amplifier (or a regular INA of your choice) with little gain gives 6Vpp output.
As the oscillator cannot display log scales, only the last high (current-) voltage peak is visible.
It's symmetrical due to the original triangle waveform - a sawtooth (not available in tina) would yield an assymmetrical log signal.
Attachments
Sorry, to me this not looks like log but like antilog.t's symmetrical due to the original triangle waveform
The aim is to generate an exponential 10^x) waveform over more then one decade upwarts from 0.01mA to 10mA, to start with.
I was able to get a sawtooth in the TI-TINA softwareIt's symmetrical due to the original triangle waveform - a sawtooth (not available in tina) would yield an assymmetrical log signal.
_
Attachments

Congratulations on your TINA success. Nobel prize winning physicist Richard Feynman wrote an essay about the process you just experienced: (Amazon link) .
Whoever claimed a sawtooth was not available in TINA, was mistaken.
Whoever claimed a sawtooth was not available in TINA, was mistaken.

- Home
- Design & Build
- Equipment & Tools
- Transistor HFE - IC curve tracer?